| - Ammonia (NH3 as N), FIL, COL - |
| Lab: NWQL, PCode: 00608, MCode: CL035 |
| Login Dates: 10/14/86 through 09/30/94 |
| Open Data Set |
| Boxplot Description |
| - Ammonia (NH3 as N), FIL, COL - |
| Lab: NWQL, PCode: 00608, MCode: CL035 |
| Login Dates: 10/14/86 through 09/30/94 |
| Open Data Set |
| Boxplot Description |

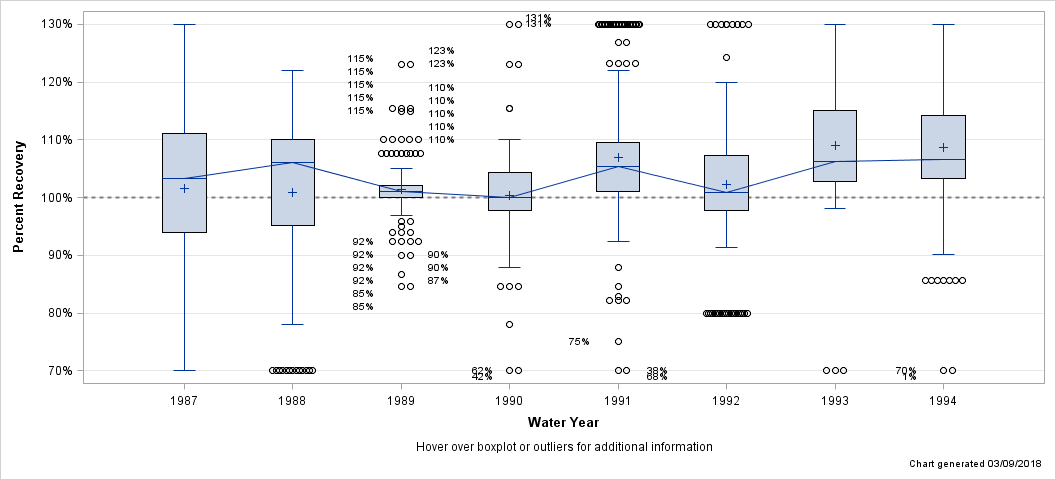
| Percent Recovery Statistics for Ammonia (NH3 as N), FIL, COL |
| Analyte | Parm-meth Code | Water Year | # of Samples |
25th Pctl | 50th Pctl (Median) |
75th Pctl |
|---|---|---|---|---|---|---|
| Ammonia (NH3 as N), FIL, COL | 00608CL035 | 1987 | 172 | 94.0% | 103.2% | 111.1% |
| 1988 | 107 | 95.1% | 106.0% | 110.0% | ||
| 1989 | 128 | 100.0% | 101.0% | 102.0% | ||
| 1990 | 192 | 97.7% | 100.0% | 104.4% | ||
| 1991 | 278 | 101.1% | 105.4% | 109.6% | ||
| 1992 | 194 | 97.7% | 101.0% | 107.3% | ||
| 1993 | 356 | 102.7% | 106.2% | 115.0% | ||
| 1994 | 288 | 103.4% | 106.6% | 114.3% |
| Hover over boxplot or outliers for additional information |
| Chart generated 03/09/2018 |
| - Ammonia (NH3 as N), FIL, COL - |
| Lab: NWQL, PCode: 00608, MCode: CL037 |
| Login Dates: 10/11/94 through 09/24/01 |
| Open Data Set |
| Boxplot Description |
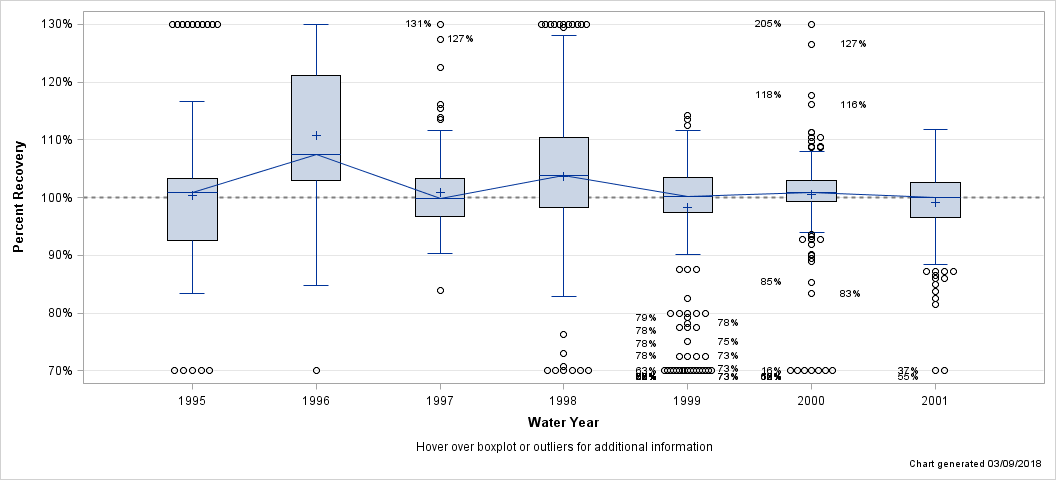
| Percent Recovery Statistics for Ammonia (NH3 as N), FIL, COL |
| Analyte | Parm-meth Code | Water Year | # of Samples |
25th Pctl | 50th Pctl (Median) |
75th Pctl |
|---|---|---|---|---|---|---|
| Ammonia (NH3 as N), FIL, COL | 00608CL037 | 1995 | 225 | 92.6% | 100.9% | 103.3% |
| 1996 | 197 | 103.0% | 107.4% | 121.2% | ||
| 1997 | 90 | 96.8% | 99.8% | 103.4% | ||
| 1998 | 330 | 98.3% | 103.8% | 110.4% | ||
| 1999 | 313 | 97.5% | 100.2% | 103.5% | ||
| 2000 | 336 | 99.3% | 100.9% | 102.9% | ||
| 2001 | 171 | 96.5% | 100.0% | 102.7% |
| Hover over boxplot or outliers for additional information |
| Chart generated 03/09/2018 |
| - Ammonia (NH3 as N), FIL, COL, LL - |
| Lab: NWQL, PCode: 00608, MCode: CL038 |
| Login Dates: 10/14/86 through 09/28/94 |
| Open Data Set |
| Boxplot Description |
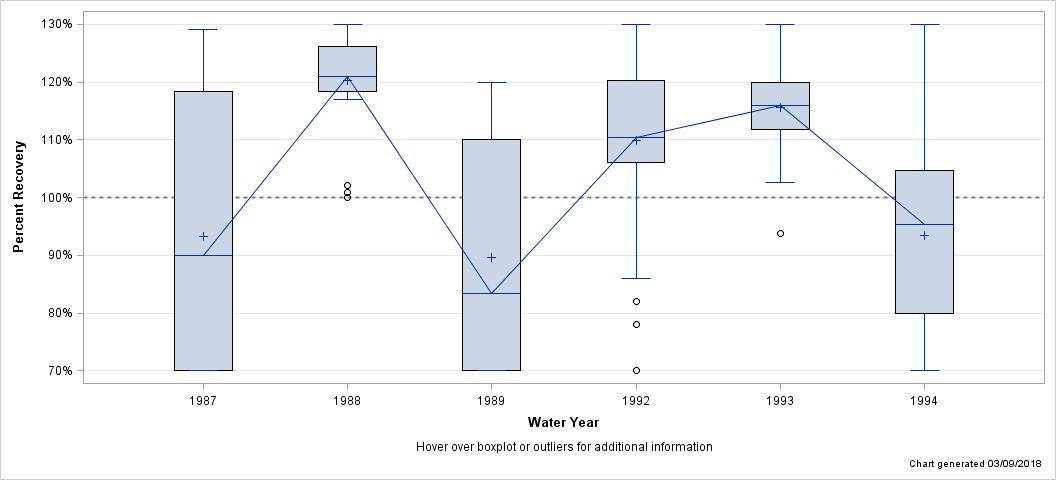
| Percent Recovery Statistics for Ammonia (NH3 as N), FIL, COL, LL |
| Analyte | Parm-meth Code | Water Year | # of Samples |
25th Pctl | 50th Pctl (Median) |
75th Pctl |
|---|---|---|---|---|---|---|
| Ammonia (NH3 as N), FIL, COL, LL | 00608CL038 | 1987 | 12 | 61.7% | 90.0% | 118.3% |
| 1988 | 20 | 118.3% | 121.0% | 126.3% | ||
| 1989 | 8 | 35.0% | 80.0% | 110.0% | ||
| 1992 | 30 | 106.0% | 110.5% | 120.3% | ||
| 1993 | 44 | 111.9% | 115.9% | 119.9% | ||
| 1994 | 70 | 80.0% | 95.3% | 104.7% |
| Hover over boxplot or outliers for additional information |
| Chart generated 03/09/2018 |
| - Ammonia (NH3 as N), FIL, COL, LL - |
| Lab: NWQL, PCode: 00608, MCode: CL039 |
| Login Dates: 11/03/94 through 09/24/01 |
| Open Data Set |
| Boxplot Description |
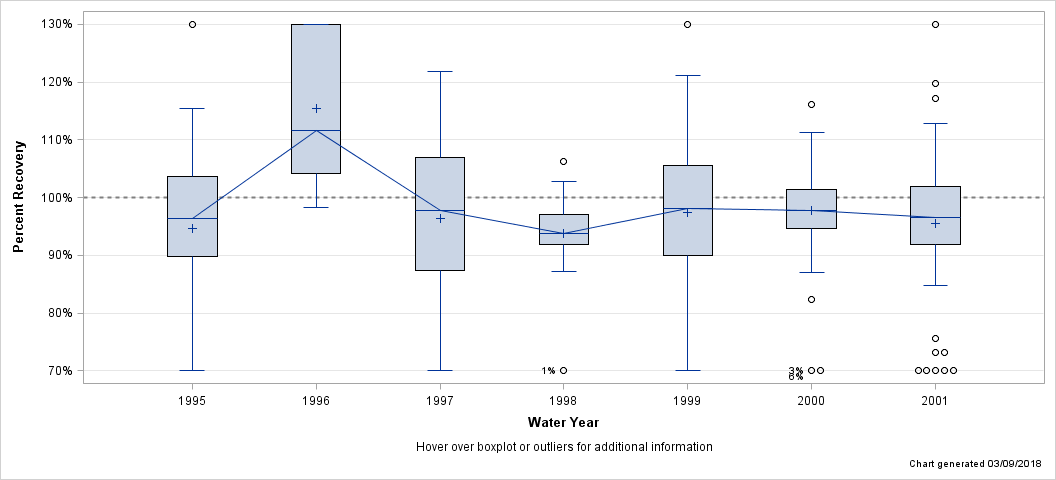
| Percent Recovery Statistics for Ammonia (NH3 as N), FIL, COL, LL |
| Analyte | Parm-meth Code | Water Year | # of Samples |
25th Pctl | 50th Pctl (Median) |
75th Pctl |
|---|---|---|---|---|---|---|
| Ammonia (NH3 as N), FIL, COL, LL | 00608CL039 | 1995 | 79 | 89.8% | 96.3% | 103.7% |
| 1996 | 10 | 104.2% | 111.7% | 153.3% | ||
| 1997 | 24 | 87.4% | 97.7% | 106.9% | ||
| 1998 | 66 | 91.9% | 93.8% | 97.1% | ||
| 1999 | 63 | 90.0% | 98.2% | 105.5% | ||
| 2000 | 66 | 94.7% | 97.8% | 101.3% | ||
| 2001 | 53 | 91.9% | 96.5% | 101.8% |
| Hover over boxplot or outliers for additional information |
| Chart generated 03/09/2018 |
| - Ammonia (NH3 as N), FIL, EPA - |
| Lab: NWQL, PCode: 00608, MCode: CL036 |
| Login Dates: 03/04/96 through 09/24/01 |
| Open Data Set |
| Boxplot Description |
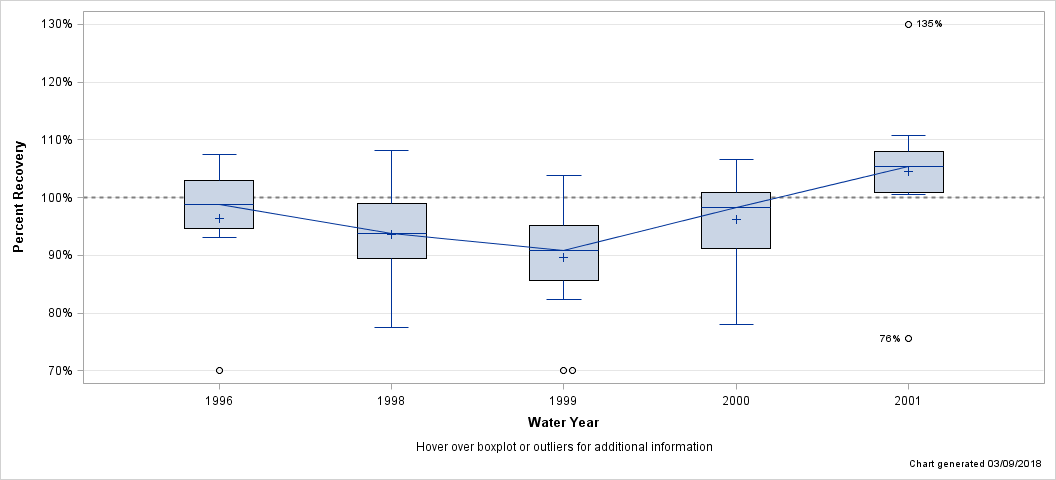
| Percent Recovery Statistics for Ammonia (NH3 as N), FIL, EPA |
| Analyte | Parm-meth Code | Water Year | # of Samples |
25th Pctl | 50th Pctl (Median) |
75th Pctl |
|---|---|---|---|---|---|---|
| Ammonia (NH3 as N), FIL, EPA | 00608CL036 | 1996 | 8 | 94.6% | 98.9% | 103.0% |
| 1998 | 17 | 89.5% | 93.7% | 99.0% | ||
| 1999 | 20 | 85.5% | 90.8% | 95.2% | ||
| 2000 | 10 | 91.1% | 98.3% | 100.9% | ||
| 2001 | 11 | 100.9% | 105.4% | 107.9% |
| Hover over boxplot or outliers for additional information |
| Chart generated 03/09/2018 |
| - Ammonia (NH3 as N), UNF - |
| Lab: NWQL, PCode: 00610, MCode: CL070 |
| Login Dates: 10/09/86 through 09/18/92 |
| Open Data Set |
| Boxplot Description |
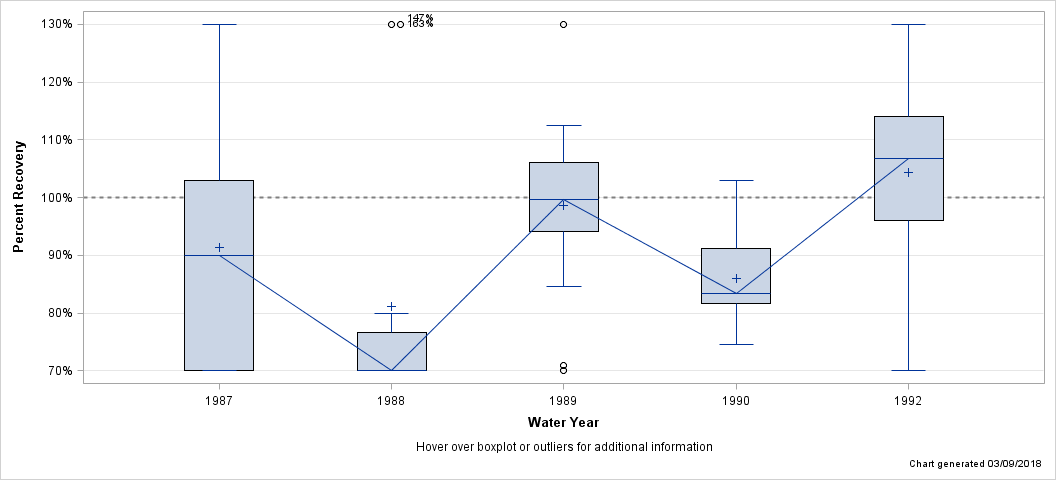
| Percent Recovery Statistics for Ammonia (NH3 as N), UNF |
| Analyte | Parm-meth Code | Water Year | # of Samples |
25th Pctl | 50th Pctl (Median) |
75th Pctl |
|---|---|---|---|---|---|---|
| Ammonia (NH3 as N), UNF | 00610CL070 | 1987 | 15 | 40.0% | 90.0% | 102.9% |
| 1988 | 12 | 40.0% | 58.3% | 76.7% | ||
| 1989 | 16 | 94.2% | 99.6% | 106.0% | ||
| 1990 | 14 | 81.7% | 83.3% | 91.3% | ||
| 1992 | 21 | 96.0% | 106.8% | 114.0% |
| Hover over boxplot or outliers for additional information |
| Chart generated 03/09/2018 |
| - Ammonia (NH3 as N), UNF - |
| Lab: NWQL, PCode: 00610, MCode: CL075 |
| Login Dates: 10/14/86 through 09/25/92 |
| Open Data Set |
| Boxplot Description |
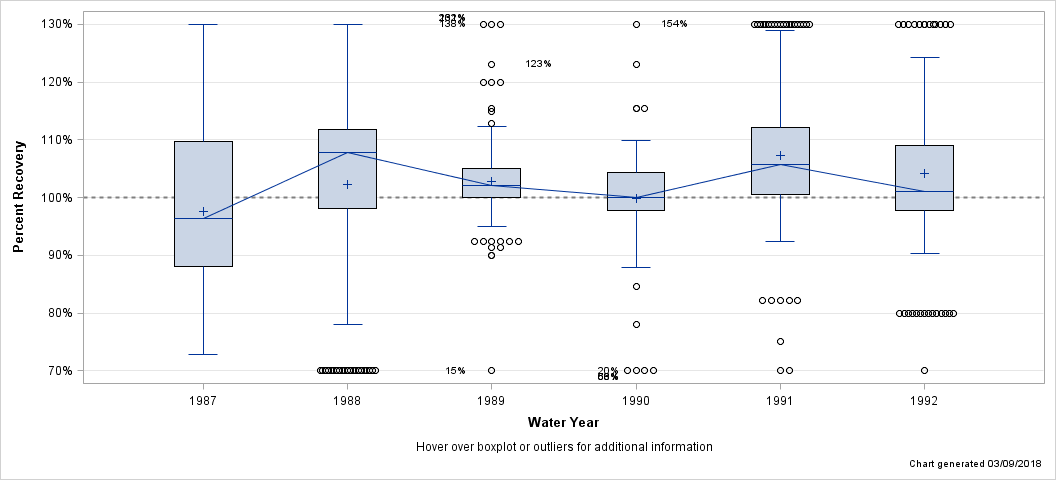
| Percent Recovery Statistics for Ammonia (NH3 as N), UNF |
| Analyte | Parm-meth Code | Water Year | # of Samples |
25th Pctl | 50th Pctl (Median) |
75th Pctl |
|---|---|---|---|---|---|---|
| Ammonia (NH3 as N), UNF | 00610CL075 | 1987 | 292 | 88.0% | 96.3% | 109.7% |
| 1988 | 161 | 98.0% | 107.8% | 111.8% | ||
| 1989 | 165 | 100.0% | 102.0% | 105.0% | ||
| 1990 | 137 | 97.7% | 100.0% | 104.4% | ||
| 1991 | 236 | 100.5% | 105.7% | 112.2% | ||
| 1992 | 184 | 97.7% | 101.1% | 109.0% |
| Hover over boxplot or outliers for additional information |
| Chart generated 03/09/2018 |
| - Ammonia+Organic-N, FIL - |
| Lab: NWQL, PCode: 00623, MCode: CL051 |
| Login Dates: 10/14/86 through 09/26/91 |
| Open Data Set |
| Boxplot Description |
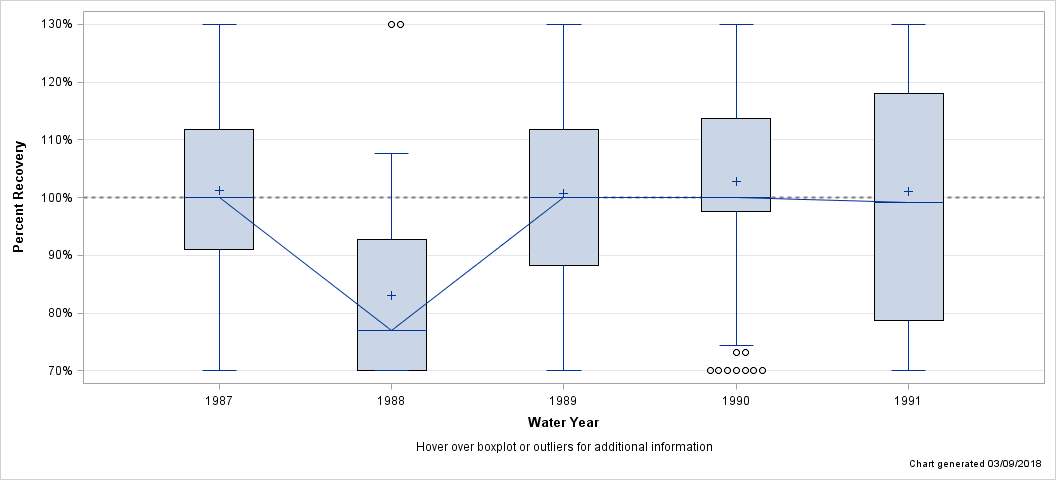
| Percent Recovery Statistics for Ammonia+Organic-N, FIL |
| Analyte | Parm-meth Code | Water Year | # of Samples |
25th Pctl | 50th Pctl (Median) |
75th Pctl |
|---|---|---|---|---|---|---|
| Ammonia+Organic-N, FIL | 00623CL051 | 1987 | 172 | 91.0% | 100.0% | 111.8% |
| 1988 | 108 | 59.5% | 76.9% | 92.8% | ||
| 1989 | 94 | 88.2% | 100.0% | 111.8% | ||
| 1990 | 129 | 97.6% | 100.0% | 113.6% | ||
| 1991 | 187 | 78.7% | 99.2% | 118.1% |
| Hover over boxplot or outliers for additional information |
| Chart generated 03/09/2018 |
| - Ammonia+Organic-N, FIL, ASF - |
| Lab: NWQL, PCode: 00623, MCode: CL061 |
| Login Dates: 10/04/91 through 09/30/94 |
| Open Data Set |
| Boxplot Description |
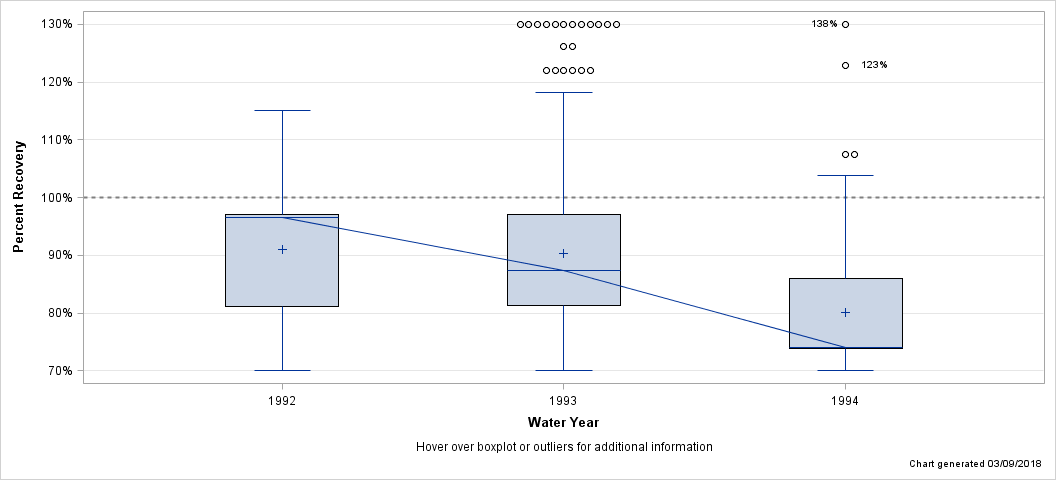
| Percent Recovery Statistics for Ammonia+Organic-N, FIL, ASF |
| Analyte | Parm-meth Code | Water Year | # of Samples |
25th Pctl | 50th Pctl (Median) |
75th Pctl |
|---|---|---|---|---|---|---|
| Ammonia+Organic-N, FIL, ASF | 00623CL061 | 1992 | 124 | 81.1% | 96.6% | 97.1% |
| 1993 | 284 | 81.3% | 87.4% | 97.1% | ||
| 1994 | 288 | 73.8% | 74.1% | 86.0% |
| Hover over boxplot or outliers for additional information |
| Chart generated 03/09/2018 |
| - Ammonia+Organic-N, UNF - |
| Lab: NWQL, PCode: 00625, MCode: CL083 |
| Login Dates: 10/14/86 through 09/26/91 |
| Open Data Set |
| Boxplot Description |
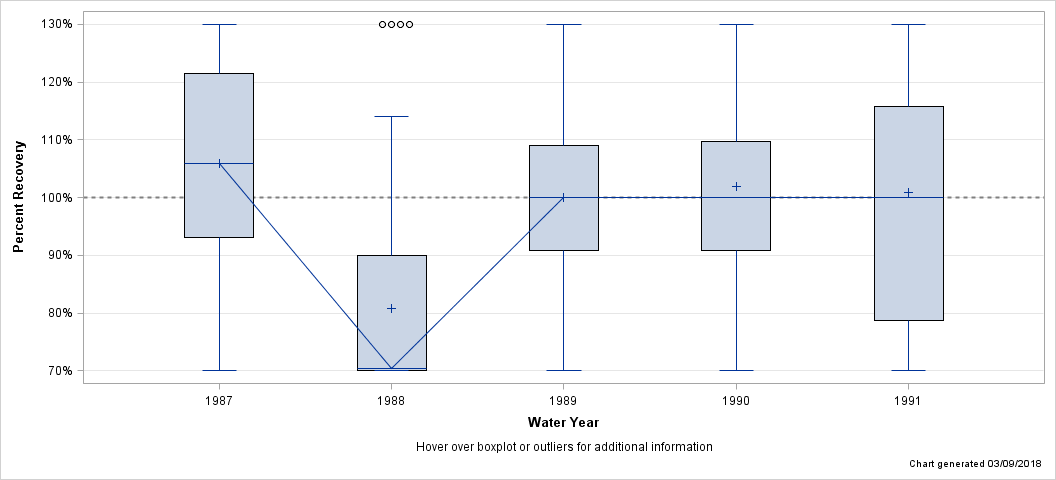
| Percent Recovery Statistics for Ammonia+Organic-N, UNF |
| Analyte | Parm-meth Code | Water Year | # of Samples |
25th Pctl | 50th Pctl (Median) |
75th Pctl |
|---|---|---|---|---|---|---|
| Ammonia+Organic-N, UNF | 00625CL083 | 1987 | 291 | 93.0% | 105.9% | 121.4% |
| 1988 | 158 | 59.5% | 69.9% | 90.0% | ||
| 1989 | 164 | 90.9% | 100.0% | 109.1% | ||
| 1990 | 137 | 90.9% | 100.0% | 109.8% | ||
| 1991 | 236 | 78.7% | 100.0% | 115.7% |
| Hover over boxplot or outliers for additional information |
| Chart generated 03/09/2018 |
| - Ammonia+Organic-N, UNF, ASF - |
| Lab: NWQL, PCode: 00625, MCode: KJ006 |
| Login Dates: 10/04/91 through 09/25/92 |
| Open Data Set |
| Boxplot Description |
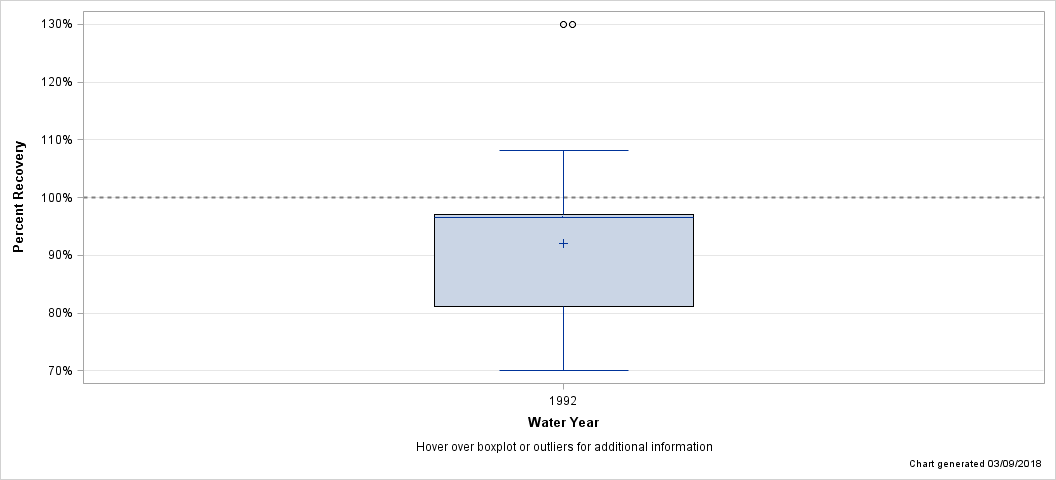
| Percent Recovery Statistics for Ammonia+Organic-N, UNF, ASF |
| Analyte | Parm-meth Code | Water Year | # of Samples |
25th Pctl | 50th Pctl (Median) |
75th Pctl |
|---|---|---|---|---|---|---|
| Ammonia+Organic-N, UNF, ASF | 00625KJ006 | 1992 | 185 | 81.1% | 96.6% | 97.1% |
| Hover over boxplot or outliers for additional information |
| Chart generated 03/09/2018 |
| - Ammonia+Organic-N, UNF, EPA - |
| Lab: NWQL, PCode: 00625, MCode: KJ007 |
| Login Dates: 02/20/96 through 03/26/99 |
| Open Data Set |
| Boxplot Description |
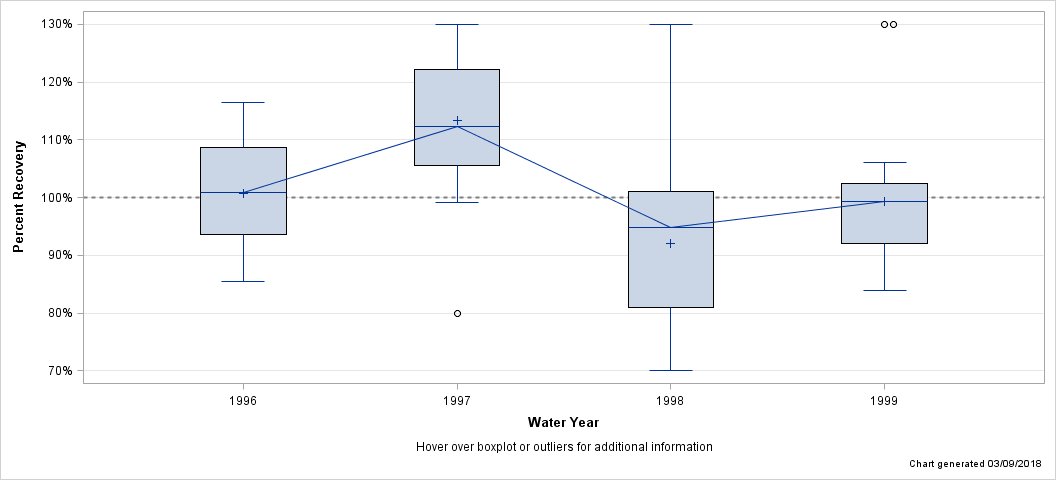
| Percent Recovery Statistics for Ammonia+Organic-N, UNF, EPA |
| Analyte | Parm-meth Code | Water Year | # of Samples |
25th Pctl | 50th Pctl (Median) |
75th Pctl |
|---|---|---|---|---|---|---|
| Ammonia+Organic-N, UNF, EPA | 00625KJ007 | 1996 | 16 | 93.5% | 100.9% | 108.7% |
| 1997 | 18 | 105.5% | 112.3% | 122.2% | ||
| 1998 | 32 | 80.9% | 94.9% | 101.0% | ||
| 1999 | 23 | 92.1% | 99.3% | 102.5% |
| Hover over boxplot or outliers for additional information |
| Chart generated 03/09/2018 |
| - Kjeldahl Nitrogen (NH3+org N as N), FIL, CFA - |
| Lab: NWQL, PCode: 00623, MCode: KJ002 |
| Login Dates: 10/11/94 through 09/24/01 |
| Open Data Set |
| Boxplot Description |
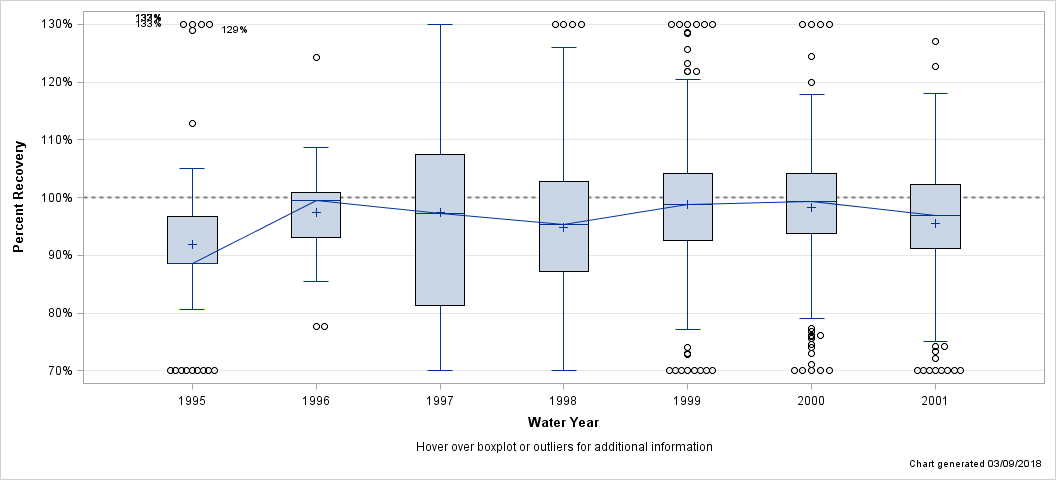
| Percent Recovery Statistics for Kjeldahl Nitrogen (NH3+org N as N), FIL, CFA |
| Analyte | Parm-meth Code | Water Year | # of Samples |
25th Pctl | 50th Pctl (Median) |
75th Pctl |
|---|---|---|---|---|---|---|
| Kjeldahl Nitrogen (NH3+org N as N), FIL, CFA | 00623KJ002 | 1995 | 170 | 88.5% | 88.5% | 96.8% |
| 1996 | 107 | 93.2% | 99.4% | 100.9% | ||
| 1997 | 90 | 81.2% | 97.3% | 107.4% | ||
| 1998 | 333 | 87.2% | 95.4% | 102.8% | ||
| 1999 | 300 | 92.5% | 98.8% | 104.2% | ||
| 2000 | 336 | 93.8% | 99.3% | 104.2% | ||
| 2001 | 173 | 91.3% | 96.9% | 102.2% |
| Hover over boxplot or outliers for additional information |
| Chart generated 03/09/2018 |
| - Kjeldahl Nitrogen (NH3+org N as N), FIL, CFA, ACD - |
| Lab: NWQL, PCode: 00623, MCode: KJ003 |
| Login Dates: 02/20/96 through 09/24/01 |
| Open Data Set |
| Boxplot Description |
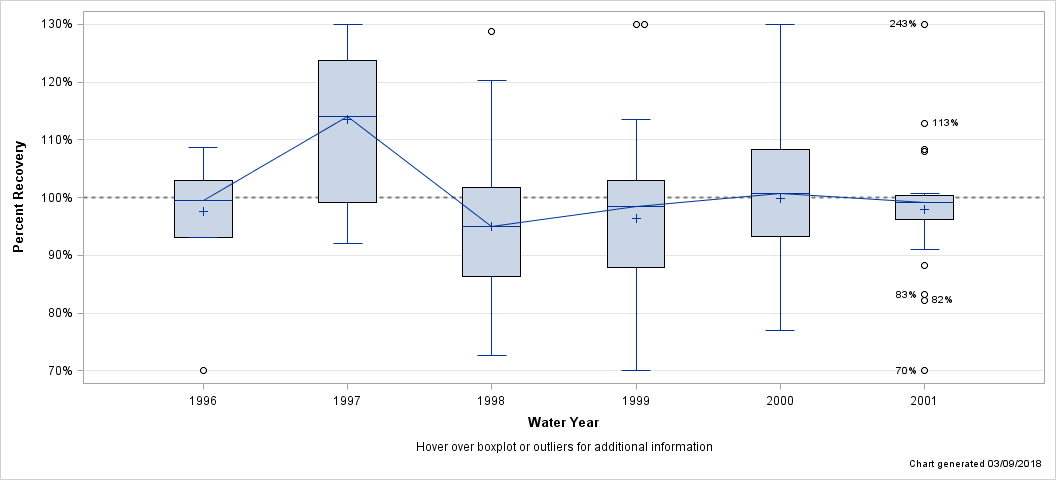
| Percent Recovery Statistics for Kjeldahl Nitrogen (NH3+org N as N), FIL, CFA, ACD |
| Analyte | Parm-meth Code | Water Year | # of Samples |
25th Pctl | 50th Pctl (Median) |
75th Pctl |
|---|---|---|---|---|---|---|
| Kjeldahl Nitrogen (NH3+org N as N), FIL, CFA, ACD | 00623KJ003 | 1996 | 16 | 93.2% | 99.4% | 103.0% |
| 1997 | 18 | 99.2% | 114.1% | 123.8% | ||
| 1998 | 32 | 86.3% | 95.1% | 101.7% | ||
| 1999 | 38 | 87.9% | 98.4% | 103.0% | ||
| 2000 | 22 | 93.2% | 100.7% | 108.3% | ||
| 2001 | 21 | 96.2% | 99.1% | 100.3% |
| Hover over boxplot or outliers for additional information |
| Chart generated 03/09/2018 |
| - Kjeldahl Nitrogen (NH3+org N as N), UNF, CFA, ACD - |
| Lab: NWQL, PCode: 00625, MCode: KJ008 |
| Login Dates: 11/03/94 through 09/24/01 |
| Open Data Set |
| Boxplot Description |
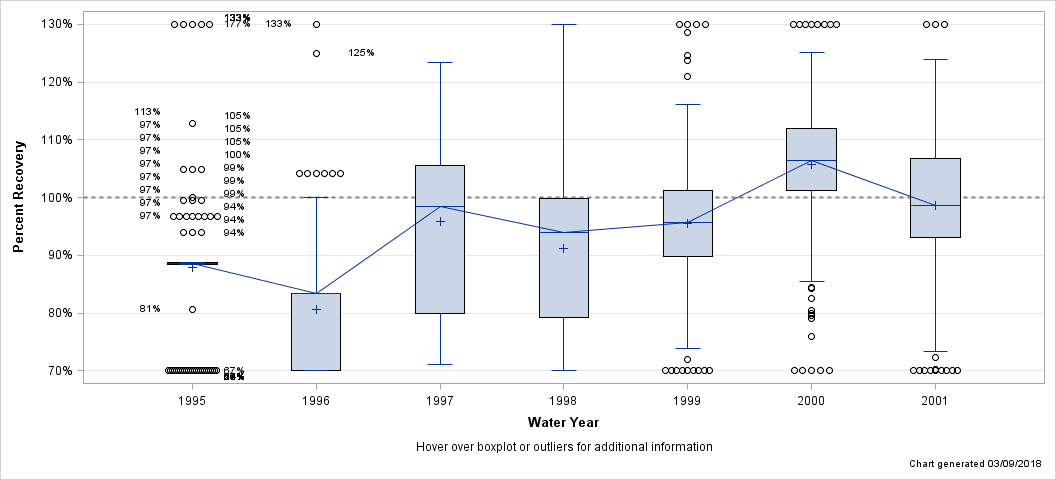
| Percent Recovery Statistics for Kjeldahl Nitrogen (NH3+org N as N), UNF, CFA, ACD |
| Analyte | Parm-meth Code | Water Year | # of Samples |
25th Pctl | 50th Pctl (Median) |
75th Pctl |
|---|---|---|---|---|---|---|
| Kjeldahl Nitrogen (NH3+org N as N), UNF, CFA, ACD | 00625KJ008 | 1995 | 106 | 88.4% | 88.5% | 88.7% |
| 1996 | 110 | 66.7% | 83.3% | 83.3% | ||
| 1997 | 90 | 80.0% | 98.4% | 105.5% | ||
| 1998 | 220 | 79.3% | 94.0% | 99.8% | ||
| 1999 | 204 | 89.9% | 95.6% | 101.3% | ||
| 2000 | 214 | 101.2% | 106.5% | 112.0% | ||
| 2001 | 216 | 93.2% | 98.7% | 106.8% |
| Hover over boxplot or outliers for additional information |
| Chart generated 03/09/2018 |
| - Nitrate plus Nitrite (NO3+NO2 as N), FIL, COL - |
| Lab: NWQL, PCode: 00631, MCode: CL045 |
| Login Dates: 10/14/86 through 09/30/94 |
| Open Data Set |
| Boxplot Description |
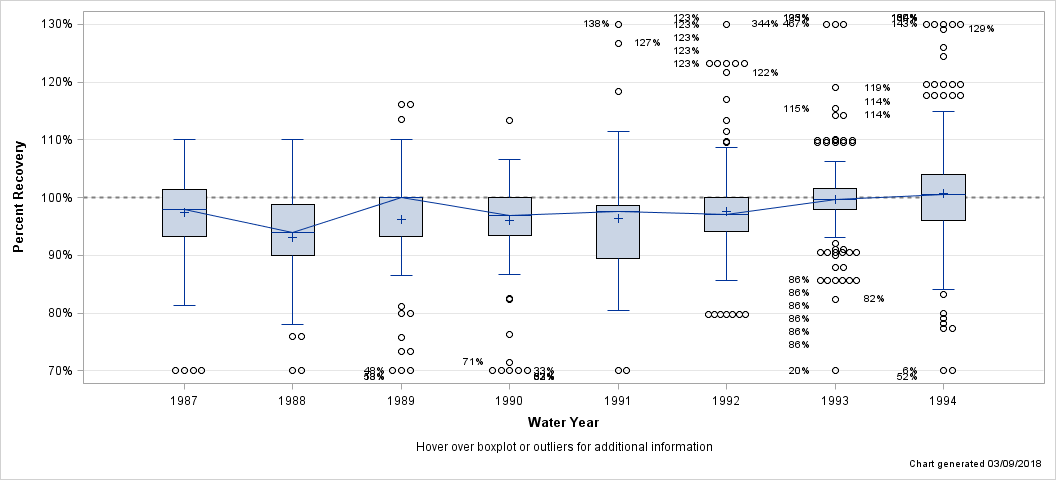
| Percent Recovery Statistics for Nitrate plus Nitrite (NO3+NO2 as N), FIL, COL |
| Analyte | Parm-meth Code | Water Year | # of Samples |
25th Pctl | 50th Pctl (Median) |
75th Pctl |
|---|---|---|---|---|---|---|
| Nitrate plus Nitrite (NO3+NO2 as N), FIL, COL | 00631CL045 | 1987 | 214 | 93.2% | 98.0% | 101.3% |
| 1988 | 107 | 90.0% | 94.0% | 98.8% | ||
| 1989 | 128 | 93.3% | 100.0% | 100.0% | ||
| 1990 | 186 | 93.4% | 97.0% | 100.0% | ||
| 1991 | 278 | 89.4% | 97.6% | 98.6% | ||
| 1992 | 194 | 94.2% | 97.0% | 100.0% | ||
| 1993 | 356 | 98.0% | 99.6% | 101.5% | ||
| 1994 | 288 | 96.0% | 100.5% | 104.0% |
| Hover over boxplot or outliers for additional information |
| Chart generated 03/09/2018 |
| - Nitrate plus Nitrite (NO3+NO2 as N), FIL, COL - |
| Lab: NWQL, PCode: 00631, MCode: CL048 |
| Login Dates: 10/11/94 through 09/24/01 |
| Open Data Set |
| Boxplot Description |
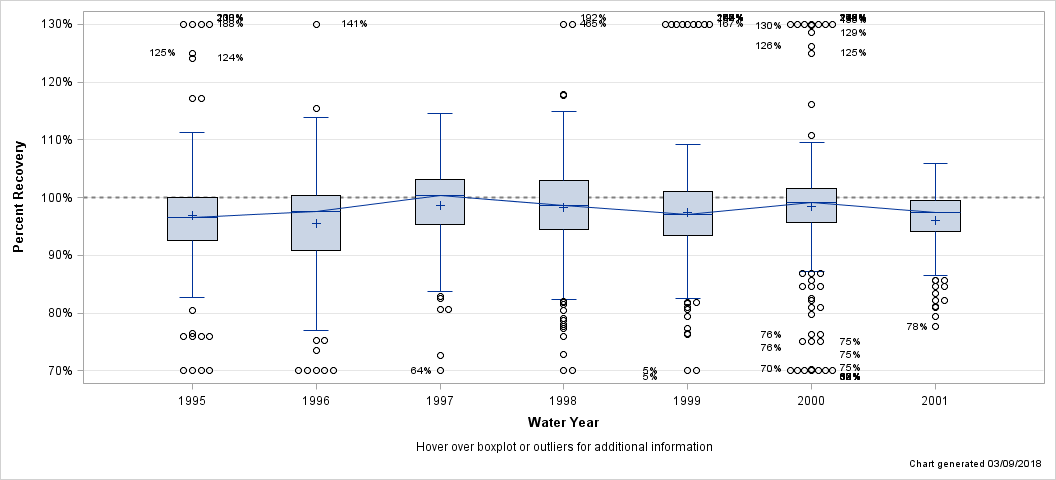
| Percent Recovery Statistics for Nitrate plus Nitrite (NO3+NO2 as N), FIL, COL |
| Analyte | Parm-meth Code | Water Year | # of Samples |
25th Pctl | 50th Pctl (Median) |
75th Pctl |
|---|---|---|---|---|---|---|
| Nitrate plus Nitrite (NO3+NO2 as N), FIL, COL | 00631CL048 | 1995 | 225 | 92.5% | 96.6% | 100.0% |
| 1996 | 217 | 90.9% | 97.6% | 100.4% | ||
| 1997 | 119 | 95.3% | 100.3% | 103.2% | ||
| 1998 | 330 | 94.5% | 98.7% | 102.9% | ||
| 1999 | 285 | 93.4% | 97.1% | 101.1% | ||
| 2000 | 280 | 95.7% | 99.1% | 101.6% | ||
| 2001 | 173 | 94.0% | 97.4% | 99.5% |
| Hover over boxplot or outliers for additional information |
| Chart generated 03/09/2018 |
| - Nitrate plus Nitrite (NO3+NO2 as N), FIL, COL, LL - |
| Lab: NWQL, PCode: 00631, MCode: CL049 |
| Login Dates: 10/08/91 through 09/28/94 |
| Open Data Set |
| Boxplot Description |
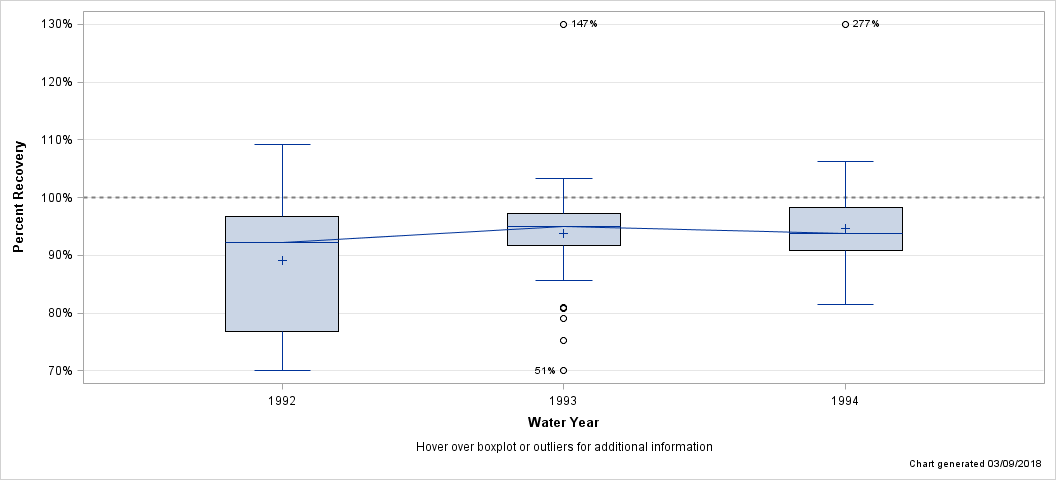
| Percent Recovery Statistics for Nitrate plus Nitrite (NO3+NO2 as N), FIL, COL, LL |
| Analyte | Parm-meth Code | Water Year | # of Samples |
25th Pctl | 50th Pctl (Median) |
75th Pctl |
|---|---|---|---|---|---|---|
| Nitrate plus Nitrite (NO3+NO2 as N), FIL, COL, LL | 00631CL049 | 1992 | 30 | 76.8% | 92.2% | 96.7% |
| 1993 | 44 | 91.8% | 95.1% | 97.3% | ||
| 1994 | 70 | 90.9% | 93.8% | 98.3% |
| Hover over boxplot or outliers for additional information |
| Chart generated 03/09/2018 |
| - Nitrate plus Nitrite (NO3+NO2 as N), FIL, COL, LL - |
| Lab: NWQL, PCode: 00631, MCode: CL050 |
| Login Dates: 11/03/94 through 09/24/01 |
| Open Data Set |
| Boxplot Description |
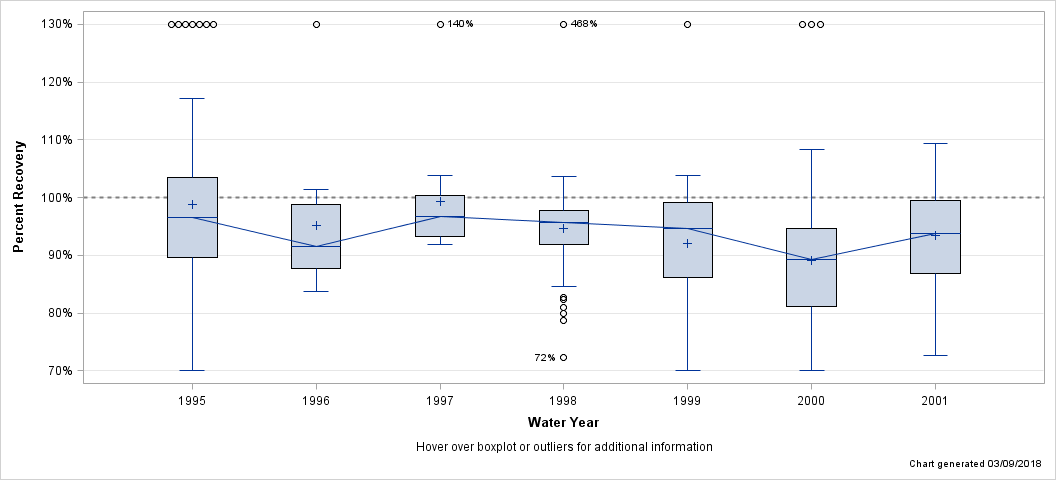
| Percent Recovery Statistics for Nitrate plus Nitrite (NO3+NO2 as N), FIL, COL, LL |
| Analyte | Parm-meth Code | Water Year | # of Samples |
25th Pctl | 50th Pctl (Median) |
75th Pctl |
|---|---|---|---|---|---|---|
| Nitrate plus Nitrite (NO3+NO2 as N), FIL, COL, LL | 00631CL050 | 1995 | 79 | 89.7% | 96.6% | 103.4% |
| 1996 | 12 | 87.6% | 91.5% | 98.8% | ||
| 1997 | 12 | 93.3% | 96.7% | 100.4% | ||
| 1998 | 66 | 91.8% | 95.6% | 97.7% | ||
| 1999 | 63 | 86.1% | 94.6% | 99.2% | ||
| 2000 | 66 | 81.1% | 89.3% | 94.6% | ||
| 2001 | 53 | 86.9% | 93.7% | 99.6% |
| Hover over boxplot or outliers for additional information |
| Chart generated 03/09/2018 |
| - Nitrate plus Nitrite (NO3+NO2 as N), FIL, EPA - |
| Lab: NWQL, PCode: 00631, MCode: CL047 |
| Login Dates: 02/20/96 through 09/24/01 |
| Open Data Set |
| Boxplot Description |
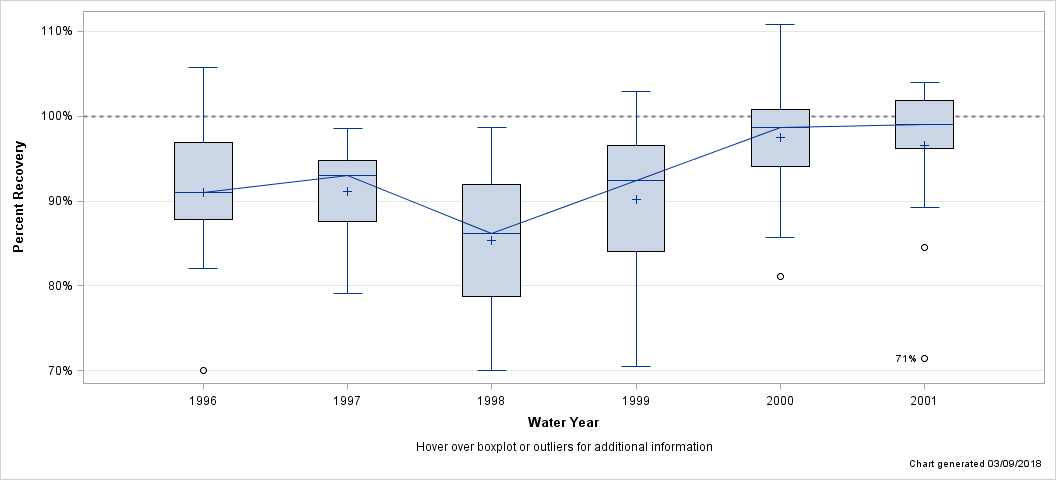
| Percent Recovery Statistics for Nitrate plus Nitrite (NO3+NO2 as N), FIL, EPA |
| Analyte | Parm-meth Code | Water Year | # of Samples |
25th Pctl | 50th Pctl (Median) |
75th Pctl |
|---|---|---|---|---|---|---|
| Nitrate plus Nitrite (NO3+NO2 as N), FIL, EPA | 00631CL047 | 1996 | 16 | 87.8% | 91.0% | 96.9% |
| 1997 | 12 | 87.6% | 93.0% | 94.8% | ||
| 1998 | 32 | 78.7% | 86.1% | 91.9% | ||
| 1999 | 34 | 84.1% | 92.4% | 96.6% | ||
| 2000 | 20 | 94.0% | 98.7% | 100.8% | ||
| 2001 | 21 | 96.1% | 99.0% | 101.8% |
| Hover over boxplot or outliers for additional information |
| Chart generated 03/09/2018 |
| - Nitrate plus Nitrite (NO3+NO2 as N), UNF - |
| Lab: NWQL, PCode: 00630, MCode: |
| Login Dates: 10/14/86 through 10/05/93 |
| Open Data Set |
| Boxplot Description |
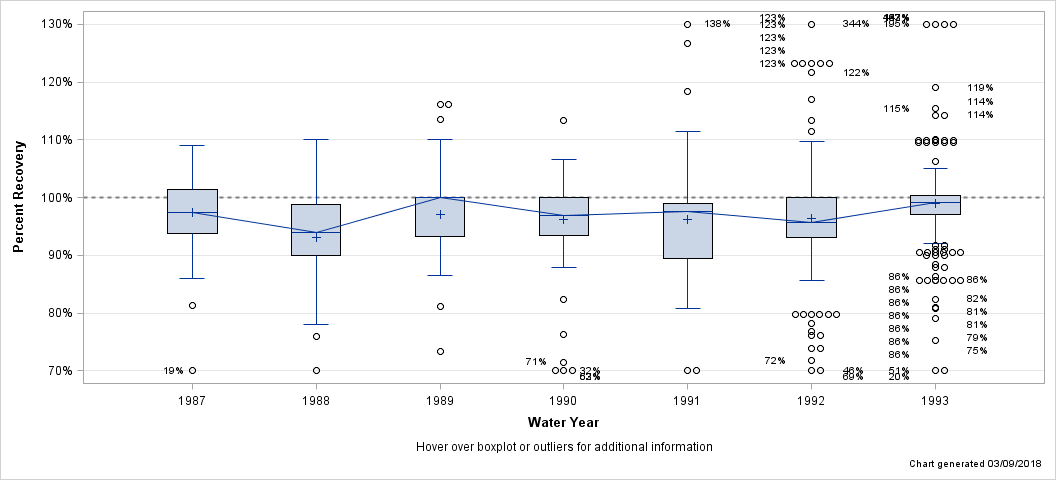
| Percent Recovery Statistics for Nitrate plus Nitrite (NO3+NO2 as N), UNF |
| Analyte | Parm-meth Code | Water Year | # of Samples |
25th Pctl | 50th Pctl (Median) |
75th Pctl |
|---|---|---|---|---|---|---|
| Nitrate plus Nitrite (NO3+NO2 as N), UNF | 00630 | 1987 | 136 | 93.8% | 97.4% | 101.3% |
| 1988 | 79 | 90.0% | 94.0% | 98.8% | ||
| 1989 | 99 | 93.3% | 100.0% | 100.0% | ||
| 1990 | 144 | 93.4% | 97.0% | 100.0% | ||
| 1991 | 233 | 89.4% | 97.6% | 99.0% | ||
| 1992 | 188 | 93.0% | 95.6% | 100.0% | ||
| 1993 | 396 | 97.0% | 99.1% | 100.4% |
| Hover over boxplot or outliers for additional information |
| Chart generated 03/09/2018 |
| - Nitrate plus Nitrite (NO3+NO2 as N), UNF - |
| Lab: NWQL, PCode: 00630, MCode: CL001 |
| Login Dates: 10/08/91 through 09/18/92 |
| Open Data Set |
| Boxplot Description |
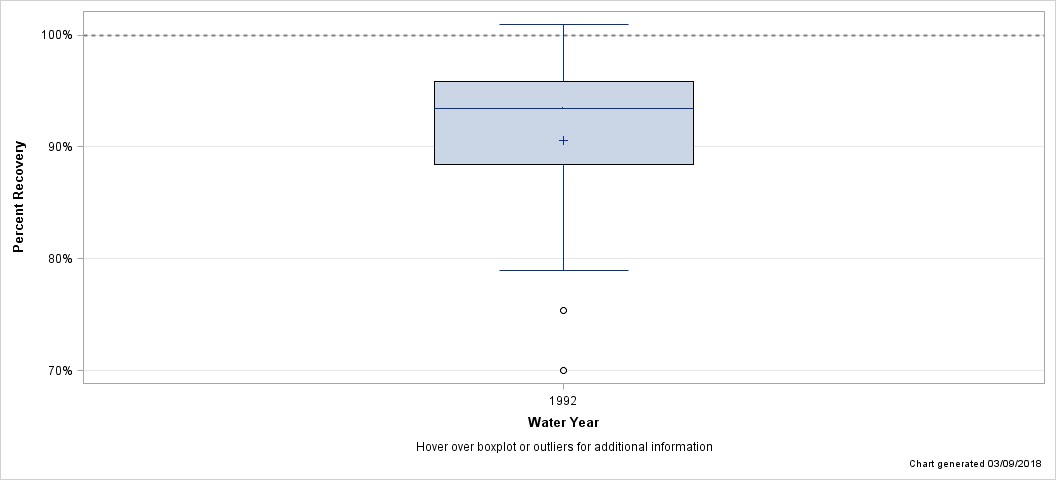
| Percent Recovery Statistics for Nitrate plus Nitrite (NO3+NO2 as N), UNF |
| Analyte | Parm-meth Code | Water Year | # of Samples |
25th Pctl | 50th Pctl (Median) |
75th Pctl |
|---|---|---|---|---|---|---|
| Nitrate plus Nitrite (NO3+NO2 as N), UNF | 00630CL001 | 1992 | 21 | 88.4% | 93.5% | 95.9% |
| Hover over boxplot or outliers for additional information |
| Chart generated 03/09/2018 |
| - Nitrate plus Nitrite (NO3+NO2 as N), UNF - |
| Lab: NWQL, PCode: 00630, MCode: CL081 |
| Login Dates: 10/14/86 through 09/25/92 |
| Open Data Set |
| Boxplot Description |
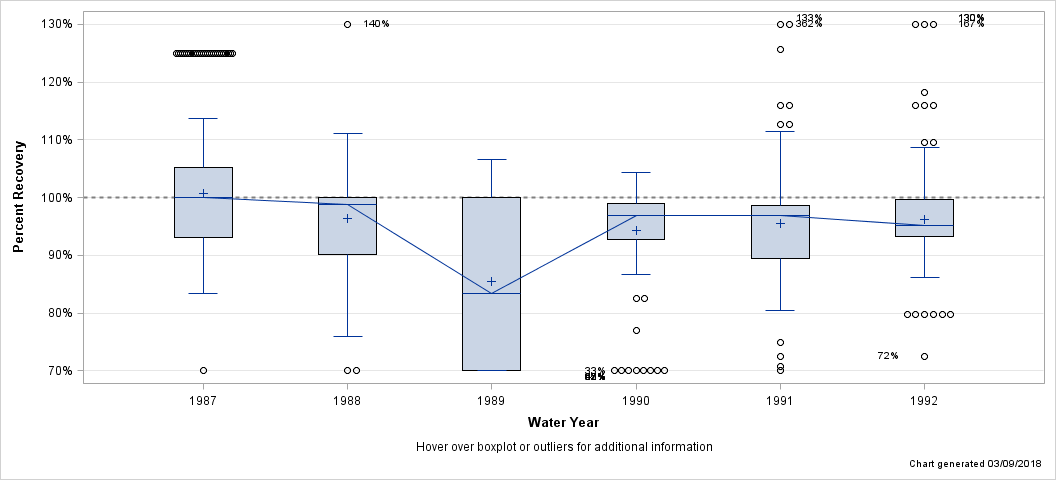
| Percent Recovery Statistics for Nitrate plus Nitrite (NO3+NO2 as N), UNF |
| Analyte | Parm-meth Code | Water Year | # of Samples |
25th Pctl | 50th Pctl (Median) |
75th Pctl |
|---|---|---|---|---|---|---|
| Nitrate plus Nitrite (NO3+NO2 as N), UNF | 00630CL081 | 1987 | 292 | 93.0% | 100.0% | 105.3% |
| 1988 | 161 | 90.1% | 98.8% | 100.0% | ||
| 1989 | 165 | 51.5% | 83.3% | 100.0% | ||
| 1990 | 137 | 92.8% | 97.0% | 98.9% | ||
| 1991 | 235 | 89.4% | 97.0% | 98.6% | ||
| 1992 | 184 | 93.3% | 95.2% | 99.7% |
| Hover over boxplot or outliers for additional information |
| Chart generated 03/09/2018 |
| - Nitrite (NO2 as N), FIL, COL - |
| Lab: NWQL, PCode: 00613, MCode: CL040 |
| Login Dates: 10/14/86 through 04/26/91 |
| Open Data Set |
| Boxplot Description |
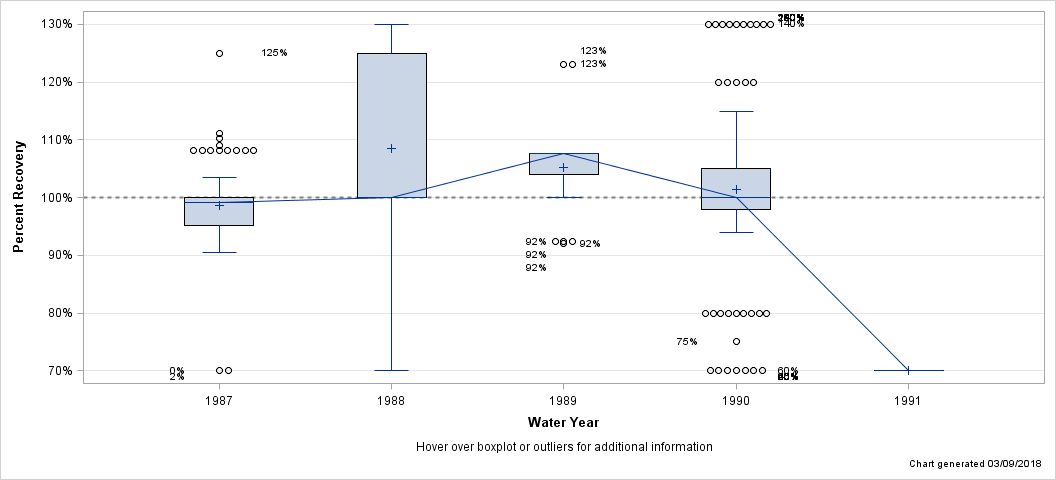
| Percent Recovery Statistics for Nitrite (NO2 as N), FIL, COL |
| Analyte | Parm-meth Code | Water Year | # of Samples |
25th Pctl | 50th Pctl (Median) |
75th Pctl |
|---|---|---|---|---|---|---|
| Nitrite (NO2 as N), FIL, COL | 00613CL040 | 1987 | 89 | 95.2% | 99.1% | 100.0% |
| 1988 | 65 | 100.0% | 100.0% | 125.0% | ||
| 1989 | 87 | 104.0% | 107.7% | 107.7% | ||
| 1990 | 115 | 98.0% | 100.0% | 105.0% | ||
| 1991 | 71 | 27.8% | 37.0% | 52.6% |
| Hover over boxplot or outliers for additional information |
| Chart generated 03/09/2018 |
| - Nitrite (NO2 as N), UNF - |
| Lab: NWQL, PCode: 00615, MCode: CL076 |
| Login Dates: 10/14/86 through 04/30/91 |
| Open Data Set |
| Boxplot Description |
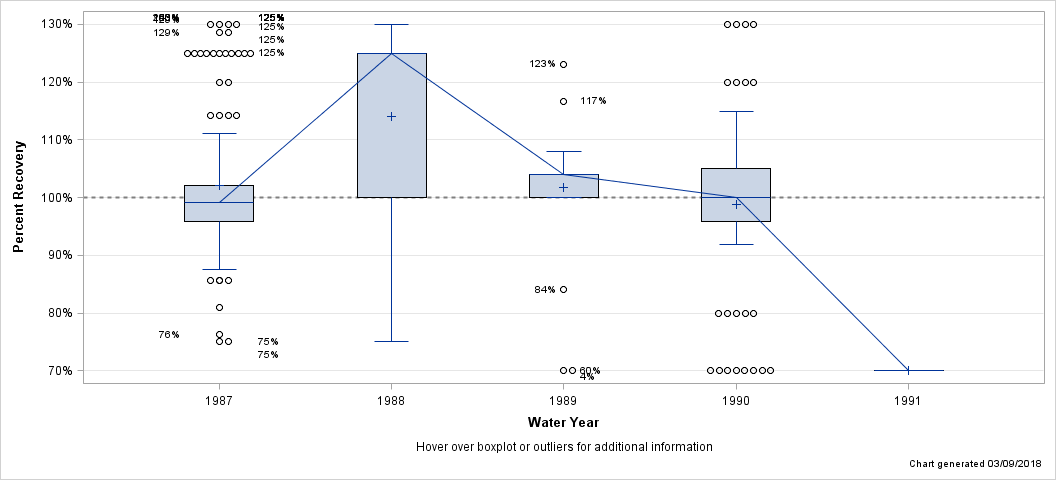
| Percent Recovery Statistics for Nitrite (NO2 as N), UNF |
| Analyte | Parm-meth Code | Water Year | # of Samples |
25th Pctl | 50th Pctl (Median) |
75th Pctl |
|---|---|---|---|---|---|---|
| Nitrite (NO2 as N), UNF | 00615CL076 | 1987 | 122 | 95.9% | 99.1% | 102.0% |
| 1988 | 52 | 100.0% | 125.0% | 125.0% | ||
| 1989 | 53 | 100.0% | 104.0% | 104.0% | ||
| 1990 | 89 | 95.9% | 100.0% | 105.0% | ||
| 1991 | 64 | 32.4% | 52.6% | 52.6% |
| Hover over boxplot or outliers for additional information |
| Chart generated 03/09/2018 |
| - Orthophosphate (PO4 as P), FIL, COL - |
| Lab: NWQL, PCode: 00671, MCode: CL053 |
| Login Dates: 10/11/94 through 09/24/01 |
| Open Data Set |
| Boxplot Description |
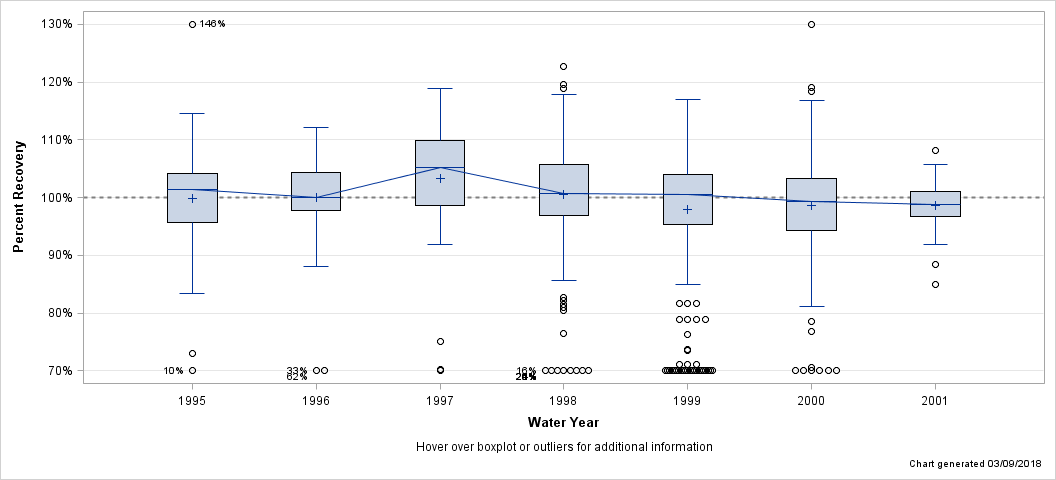
| Percent Recovery Statistics for Orthophosphate (PO4 as P), FIL, COL |
| Analyte | Parm-meth Code | Water Year | # of Samples |
25th Pctl | 50th Pctl (Median) |
75th Pctl |
|---|---|---|---|---|---|---|
| Orthophosphate (PO4 as P), FIL, COL | 00671CL053 | 1995 | 195 | 95.7% | 101.3% | 104.2% |
| 1996 | 107 | 97.8% | 100.0% | 104.3% | ||
| 1997 | 91 | 98.7% | 105.3% | 109.9% | ||
| 1998 | 329 | 96.8% | 100.7% | 105.7% | ||
| 1999 | 316 | 95.3% | 100.6% | 104.0% | ||
| 2000 | 336 | 94.3% | 99.3% | 103.4% | ||
| 2001 | 149 | 96.7% | 98.8% | 101.0% |
| Hover over boxplot or outliers for additional information |
| Chart generated 03/09/2018 |
| - Orthophosphate (PO4 as P), FIL, COL - |
| Lab: NWQL, PCode: 00671, MCode: CL054 |
| Login Dates: 10/14/86 through 09/30/94 |
| Open Data Set |
| Boxplot Description |
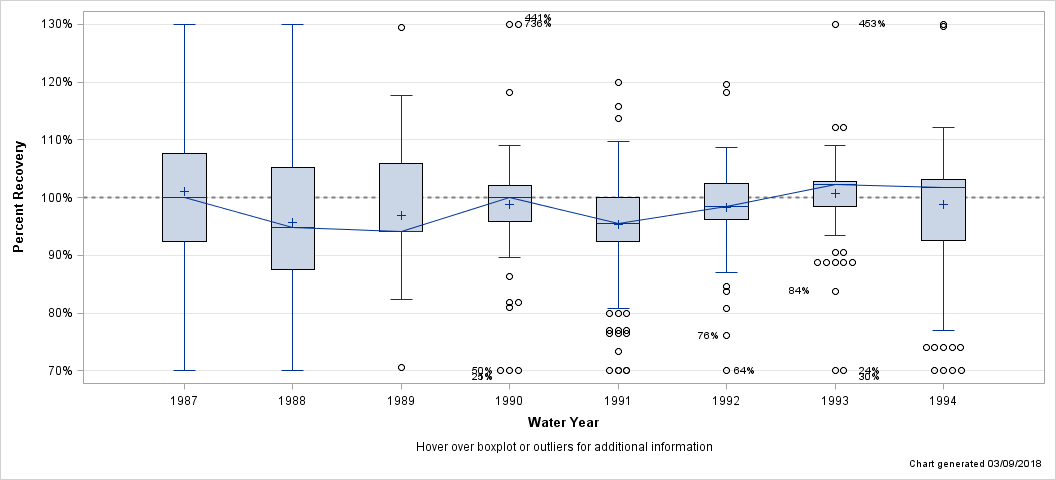
| Percent Recovery Statistics for Orthophosphate (PO4 as P), FIL, COL |
| Analyte | Parm-meth Code | Water Year | # of Samples |
25th Pctl | 50th Pctl (Median) |
75th Pctl |
|---|---|---|---|---|---|---|
| Orthophosphate (PO4 as P), FIL, COL | 00671CL054 | 1987 | 115 | 92.3% | 100.0% | 107.7% |
| 1988 | 82 | 87.5% | 94.7% | 105.3% | ||
| 1989 | 114 | 94.1% | 94.1% | 105.9% | ||
| 1990 | 166 | 95.8% | 100.0% | 102.1% | ||
| 1991 | 278 | 92.3% | 95.5% | 100.0% | ||
| 1992 | 194 | 96.2% | 98.5% | 102.4% | ||
| 1993 | 356 | 98.5% | 102.3% | 102.8% | ||
| 1994 | 288 | 92.6% | 101.7% | 103.1% |
| Hover over boxplot or outliers for additional information |
| Chart generated 03/09/2018 |
| - Orthophosphate (PO4 as P), FIL, COL, LL - |
| Lab: NWQL, PCode: 00671, MCode: CL057 |
| Login Dates: 11/03/94 through 09/24/01 |
| Open Data Set |
| Boxplot Description |
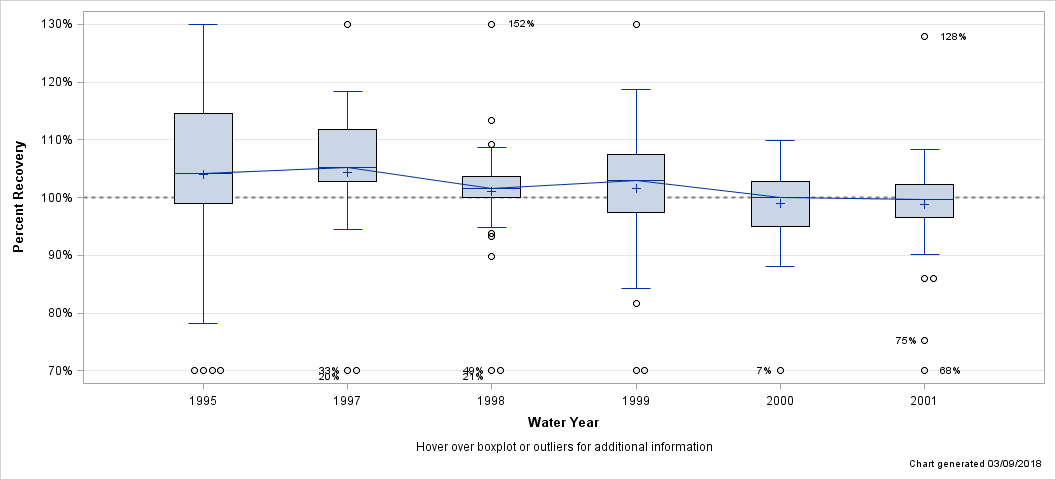
| Percent Recovery Statistics for Orthophosphate (PO4 as P), FIL, COL, LL |
| Analyte | Parm-meth Code | Water Year | # of Samples |
25th Pctl | 50th Pctl (Median) |
75th Pctl |
|---|---|---|---|---|---|---|
| Orthophosphate (PO4 as P), FIL, COL, LL | 00671CL057 | 1995 | 79 | 98.9% | 104.2% | 114.6% |
| 1997 | 24 | 102.8% | 105.3% | 111.8% | ||
| 1998 | 66 | 100.0% | 101.5% | 103.6% | ||
| 1999 | 63 | 97.4% | 103.0% | 107.5% | ||
| 2000 | 66 | 95.1% | 100.0% | 102.8% | ||
| 2001 | 53 | 96.5% | 99.6% | 102.3% |
| Hover over boxplot or outliers for additional information |
| Chart generated 03/09/2018 |
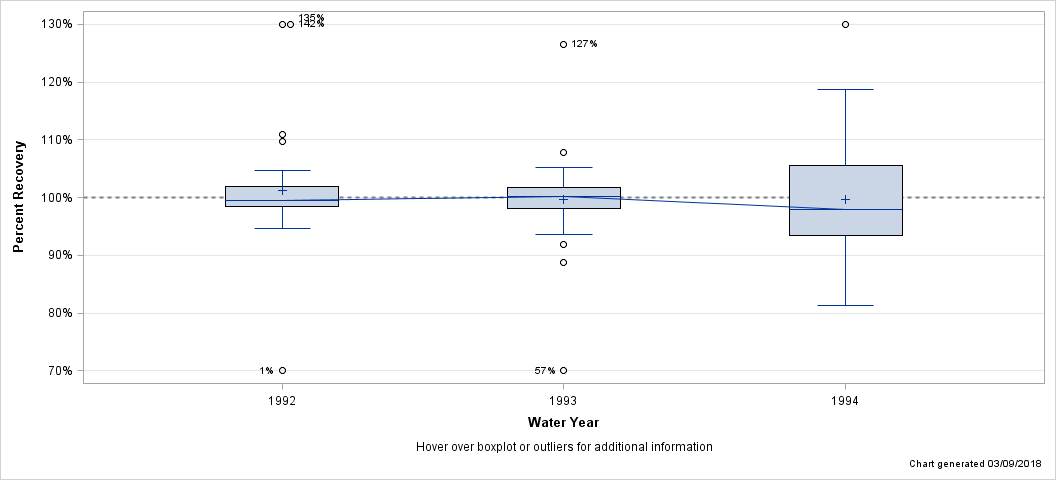
| - Orthophosphate (PO4 as P), FIL, COL, LL - |
| Lab: NWQL, PCode: 00671, MCode: CL058 |
| Login Dates: 10/08/91 through 09/28/94 |
| Open Data Set |
| Boxplot Description |
| Percent Recovery Statistics for Orthophosphate (PO4 as P), FIL, COL, LL |
| Analyte | Parm-meth Code | Water Year | # of Samples |
25th Pctl | 50th Pctl (Median) |
75th Pctl |
|---|---|---|---|---|---|---|
| Orthophosphate (PO4 as P), FIL, COL, LL | 00671CL058 | 1992 | 30 | 98.5% | 99.5% | 102.0% |
| 1993 | 44 | 98.1% | 100.2% | 101.7% | ||
| 1994 | 70 | 93.4% | 98.0% | 105.6% |
| Hover over boxplot or outliers for additional information |
| Chart generated 03/09/2018 |
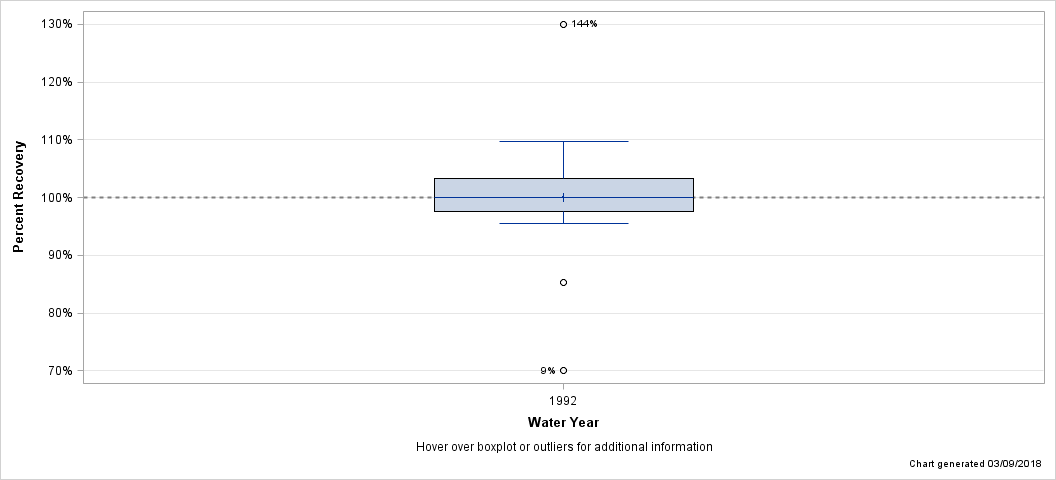
| - Orthophosphate-P, UNF - |
| Lab: NWQL, PCode: 70507, MCode: 00145 |
| Login Dates: 10/08/91 through 09/18/92 |
| Open Data Set |
| Boxplot Description |
| Percent Recovery Statistics for Orthophosphate-P, UNF |
| Analyte | Parm-meth Code | Water Year | # of Samples |
25th Pctl | 50th Pctl (Median) |
75th Pctl |
|---|---|---|---|---|---|---|
| Orthophosphate-P, UNF | 7050700145 | 1992 | 21 | 97.5% | 100.0% | 103.3% |
| Hover over boxplot or outliers for additional information |
| Chart generated 03/09/2018 |
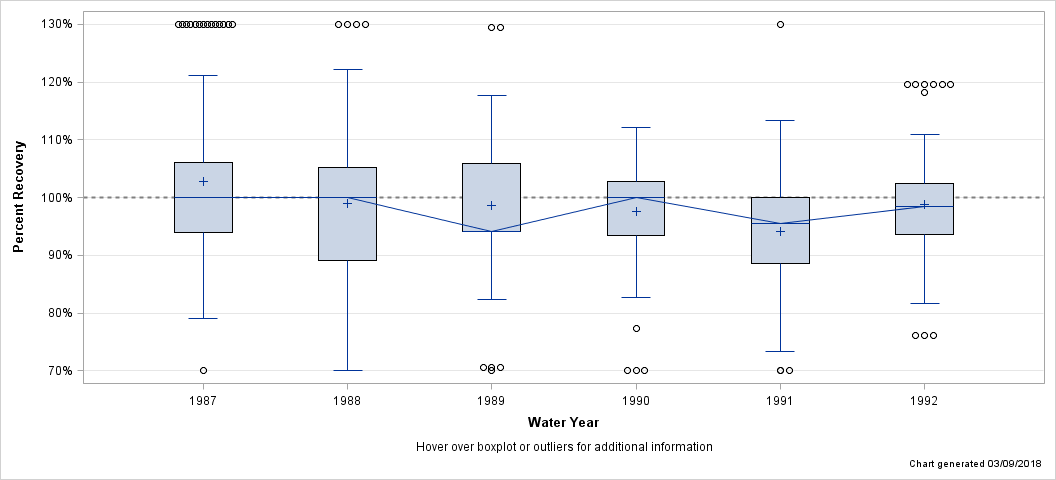
| - Orthophosphate-P, UNF - |
| Lab: NWQL, PCode: 70507, MCode: CL085 |
| Login Dates: 10/14/86 through 09/25/92 |
| Open Data Set |
| Boxplot Description |
| Percent Recovery Statistics for Orthophosphate-P, UNF |
| Analyte | Parm-meth Code | Water Year | # of Samples |
25th Pctl | 50th Pctl (Median) |
75th Pctl |
|---|---|---|---|---|---|---|
| Orthophosphate-P, UNF | 70507CL085 | 1987 | 115 | 93.9% | 100.0% | 106.1% |
| 1988 | 68 | 89.2% | 100.0% | 105.3% | ||
| 1989 | 46 | 94.1% | 94.1% | 105.9% | ||
| 1990 | 53 | 93.5% | 100.0% | 102.8% | ||
| 1991 | 236 | 88.6% | 95.5% | 100.0% | ||
| 1992 | 184 | 93.6% | 98.5% | 102.4% |
| Hover over boxplot or outliers for additional information |
| Chart generated 03/09/2018 |
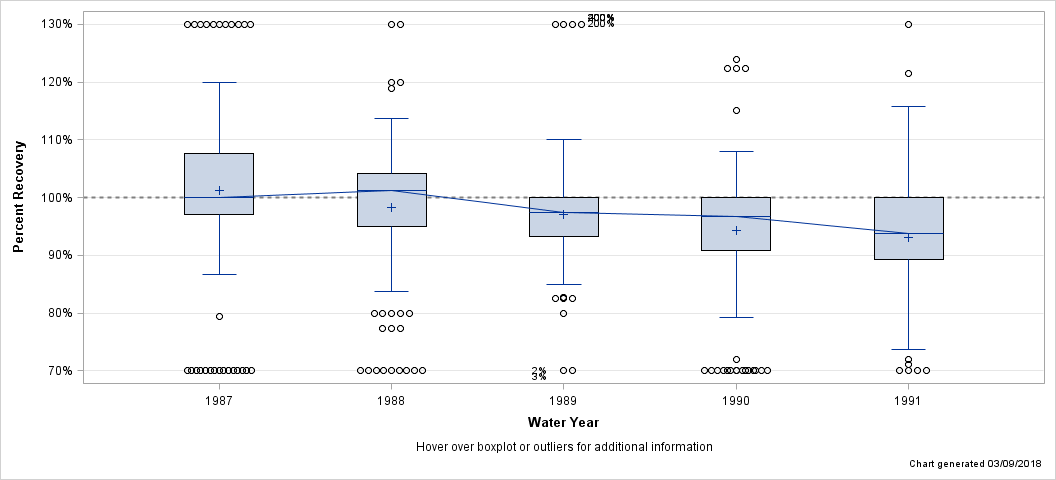
| - Phosphorus (as P), FIL - |
| Lab: NWQL, PCode: 00666, MCode: CL052 |
| Login Dates: 10/14/86 through 09/26/91 |
| Open Data Set |
| Boxplot Description |
| Percent Recovery Statistics for Phosphorus (as P), FIL |
| Analyte | Parm-meth Code | Water Year | # of Samples |
25th Pctl | 50th Pctl (Median) |
75th Pctl |
|---|---|---|---|---|---|---|
| Phosphorus (as P), FIL | 00666CL052 | 1987 | 208 | 97.0% | 100.0% | 107.6% |
| 1988 | 108 | 95.0% | 101.3% | 104.1% | ||
| 1989 | 128 | 93.2% | 97.5% | 100.0% | ||
| 1990 | 217 | 90.9% | 96.7% | 100.0% | ||
| 1991 | 189 | 89.3% | 93.8% | 100.0% |
| Hover over boxplot or outliers for additional information |
| Chart generated 03/09/2018 |
| - Phosphorus (as P), FIL, ASF - |
| Lab: NWQL, PCode: 00666, MCode: CL061 |
| Login Dates: 10/04/91 through 09/30/94 |
| Open Data Set |
| Boxplot Description |
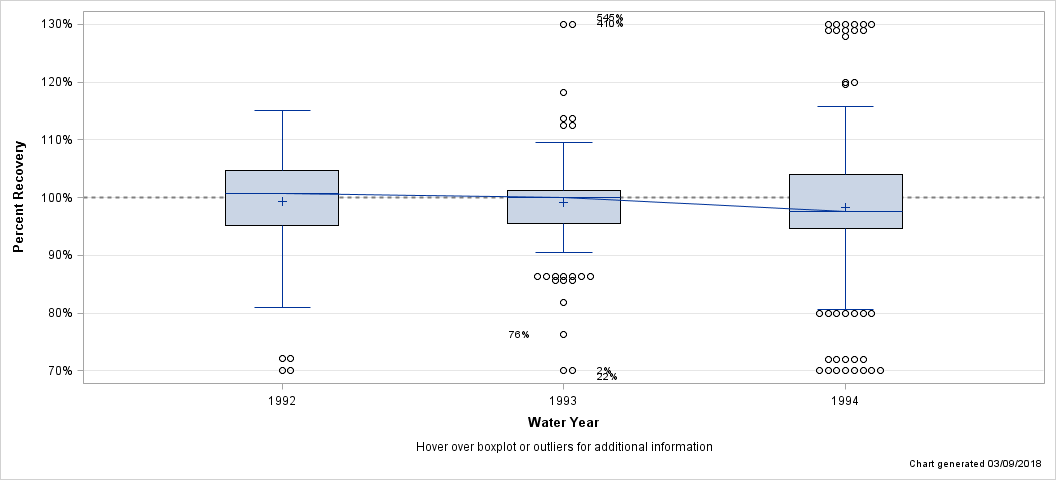
| Percent Recovery Statistics for Phosphorus (as P), FIL, ASF |
| Analyte | Parm-meth Code | Water Year | # of Samples |
25th Pctl | 50th Pctl (Median) |
75th Pctl |
|---|---|---|---|---|---|---|
| Phosphorus (as P), FIL, ASF | 00666CL061 | 1992 | 124 | 95.2% | 100.7% | 104.8% |
| 1993 | 284 | 95.5% | 100.0% | 101.2% | ||
| 1994 | 288 | 94.6% | 97.6% | 104.0% |
| Hover over boxplot or outliers for additional information |
| Chart generated 03/09/2018 |
| - Phosphorus (as P), FIL, CFA, ACD-P, LL - |
| Lab: NWQL, PCode: 00666, MCode: CL020 |
| Login Dates: 01/06/99 through 09/24/01 |
| Open Data Set |
| Boxplot Description |
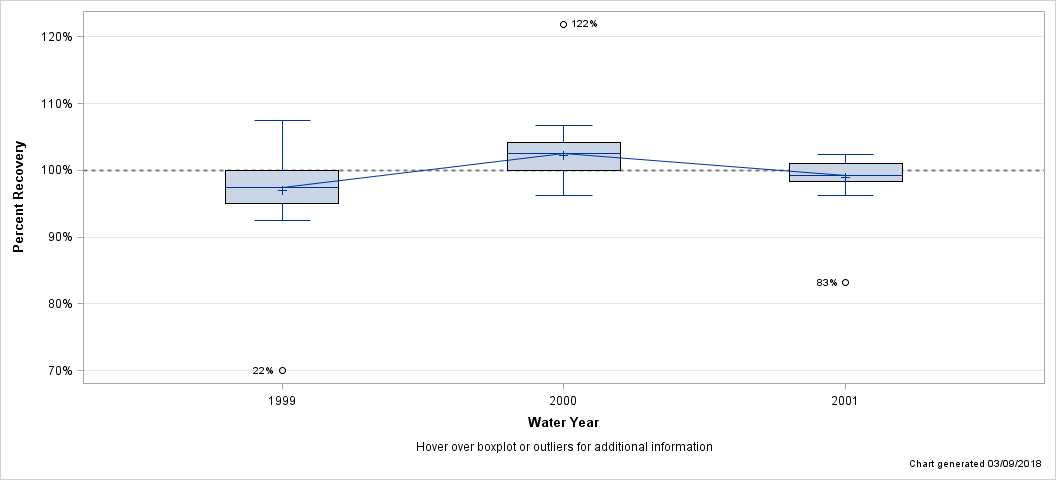
| Percent Recovery Statistics for Phosphorus (as P), FIL, CFA, ACD-P, LL |
| Analyte | Parm-meth Code | Water Year | # of Samples |
25th Pctl | 50th Pctl (Median) |
75th Pctl |
|---|---|---|---|---|---|---|
| Phosphorus (as P), FIL, CFA, ACD-P, LL | 00666CL020 | 1999 | 22 | 95.0% | 97.5% | 100.0% |
| 2000 | 66 | 100.0% | 102.5% | 104.2% | ||
| 2001 | 25 | 98.4% | 99.3% | 101.0% |
| Hover over boxplot or outliers for additional information |
| Chart generated 03/09/2018 |
| - Phosphorus (as P), FIL, CFA, Kjeldahl - |
| Lab: NWQL, PCode: 00666, MCode: KJ005 |
| Login Dates: 10/11/94 through 09/24/01 |
| Open Data Set |
| Boxplot Description |
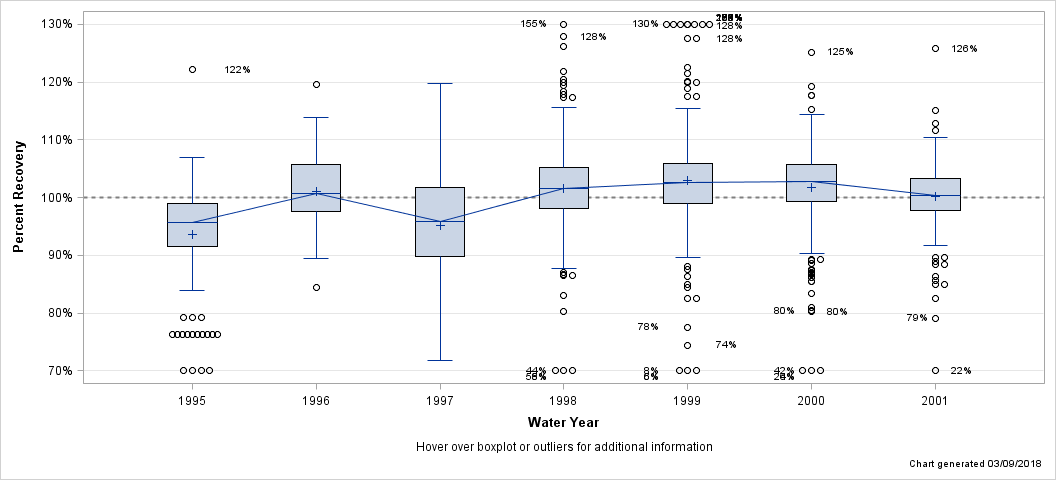
| Percent Recovery Statistics for Phosphorus (as P), FIL, CFA, Kjeldahl |
| Analyte | Parm-meth Code | Water Year | # of Samples |
25th Pctl | 50th Pctl (Median) |
75th Pctl |
|---|---|---|---|---|---|---|
| Phosphorus (as P), FIL, CFA, Kjeldahl | 00666KJ005 | 1995 | 175 | 91.6% | 95.7% | 98.9% |
| 1996 | 107 | 97.6% | 100.8% | 105.7% | ||
| 1997 | 30 | 89.8% | 95.8% | 101.8% | ||
| 1998 | 334 | 98.0% | 101.5% | 105.2% | ||
| 1999 | 315 | 99.0% | 102.6% | 105.8% | ||
| 2000 | 336 | 99.4% | 102.8% | 105.7% | ||
| 2001 | 200 | 97.8% | 100.4% | 103.3% |
| Hover over boxplot or outliers for additional information |
| Chart generated 03/09/2018 |
| - Phosphorus (as P), FIL, COL, LL - |
| Lab: NWQL, PCode: 00666, MCode: CL059 |
| Login Dates: 10/08/91 through 09/28/94 |
| Open Data Set |
| Boxplot Description |
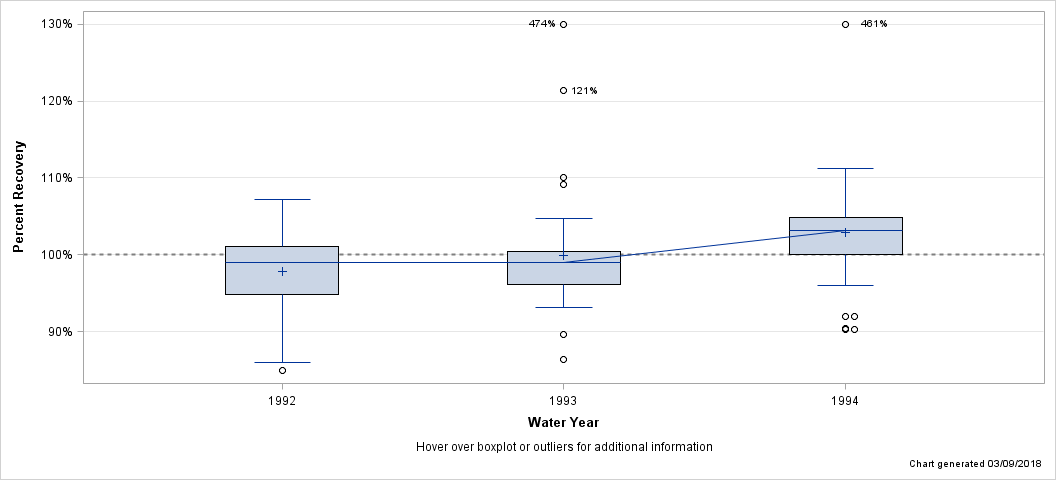
| Percent Recovery Statistics for Phosphorus (as P), FIL, COL, LL |
| Analyte | Parm-meth Code | Water Year | # of Samples |
25th Pctl | 50th Pctl (Median) |
75th Pctl |
|---|---|---|---|---|---|---|
| Phosphorus (as P), FIL, COL, LL | 00666CL059 | 1992 | 29 | 94.8% | 99.0% | 101.0% |
| 1993 | 44 | 96.1% | 99.0% | 100.5% | ||
| 1994 | 70 | 100.0% | 103.2% | 104.8% |
| Hover over boxplot or outliers for additional information |
| Chart generated 03/09/2018 |
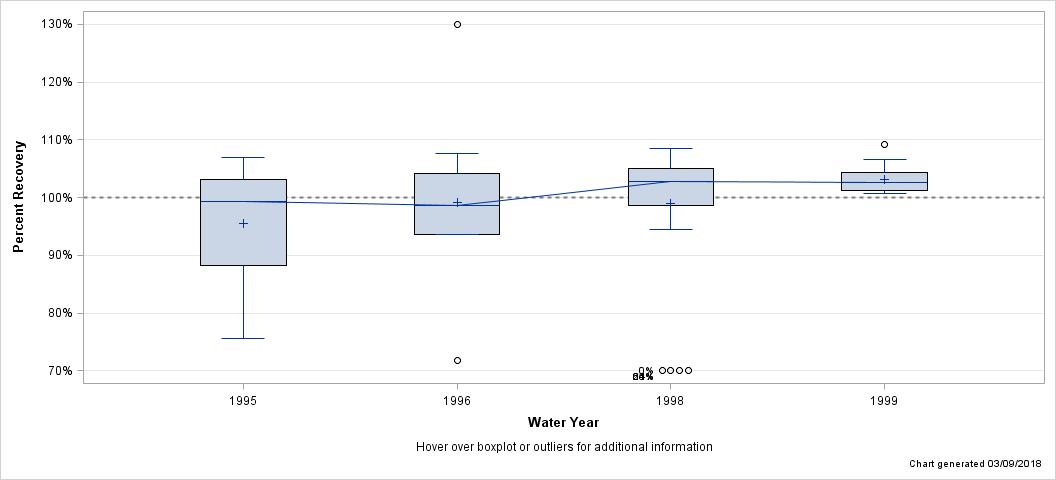
| - Phosphorus (as P), FIL, COL, LL - |
| Lab: NWQL, PCode: 00666, MCode: CL060 |
| Login Dates: 04/11/95 through 12/30/98 |
| Open Data Set |
| Boxplot Description |
| Percent Recovery Statistics for Phosphorus (as P), FIL, COL, LL |
| Analyte | Parm-meth Code | Water Year | # of Samples |
25th Pctl | 50th Pctl (Median) |
75th Pctl |
|---|---|---|---|---|---|---|
| Phosphorus (as P), FIL, COL, LL | 00666CL060 | 1995 | 8 | 88.2% | 99.2% | 103.1% |
| 1996 | 12 | 93.5% | 98.7% | 104.2% | ||
| 1998 | 33 | 98.7% | 102.8% | 105.0% | ||
| 1999 | 21 | 101.2% | 102.7% | 104.4% |
| Hover over boxplot or outliers for additional information |
| Chart generated 03/09/2018 |
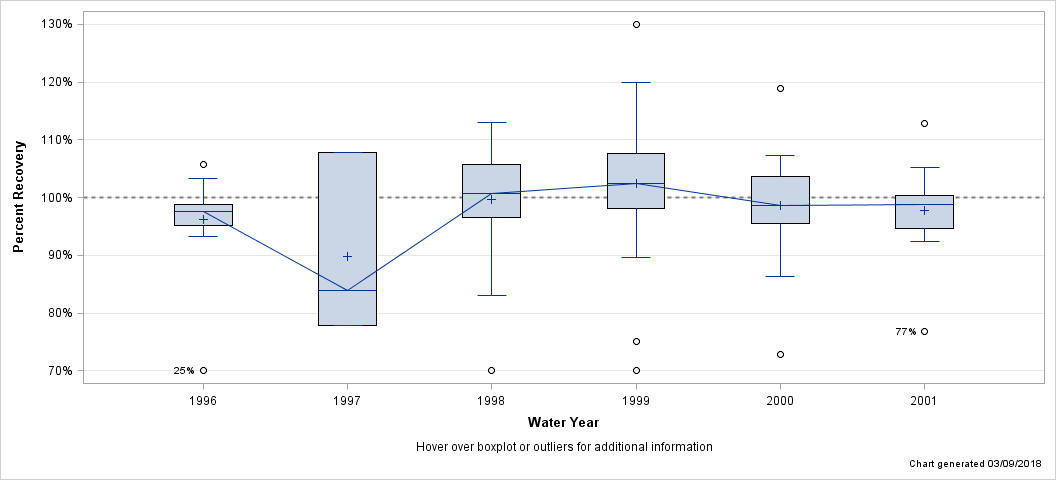
| - Phosphorus (as P), FIL, EPA - |
| Lab: NWQL, PCode: 00666, MCode: KJ004 |
| Login Dates: 02/20/96 through 09/24/01 |
| Open Data Set |
| Boxplot Description |
| Percent Recovery Statistics for Phosphorus (as P), FIL, EPA |
| Analyte | Parm-meth Code | Water Year | # of Samples |
25th Pctl | 50th Pctl (Median) |
75th Pctl |
|---|---|---|---|---|---|---|
| Phosphorus (as P), FIL, EPA | 00666KJ004 | 1996 | 16 | 95.1% | 97.6% | 98.9% |
| 1997 | 6 | 77.8% | 83.8% | 107.8% | ||
| 1998 | 32 | 96.5% | 100.7% | 105.7% | ||
| 1999 | 37 | 98.1% | 102.5% | 107.7% | ||
| 2000 | 22 | 95.6% | 98.6% | 103.6% | ||
| 2001 | 21 | 94.6% | 98.7% | 100.4% |
| Hover over boxplot or outliers for additional information |
| Chart generated 03/09/2018 |
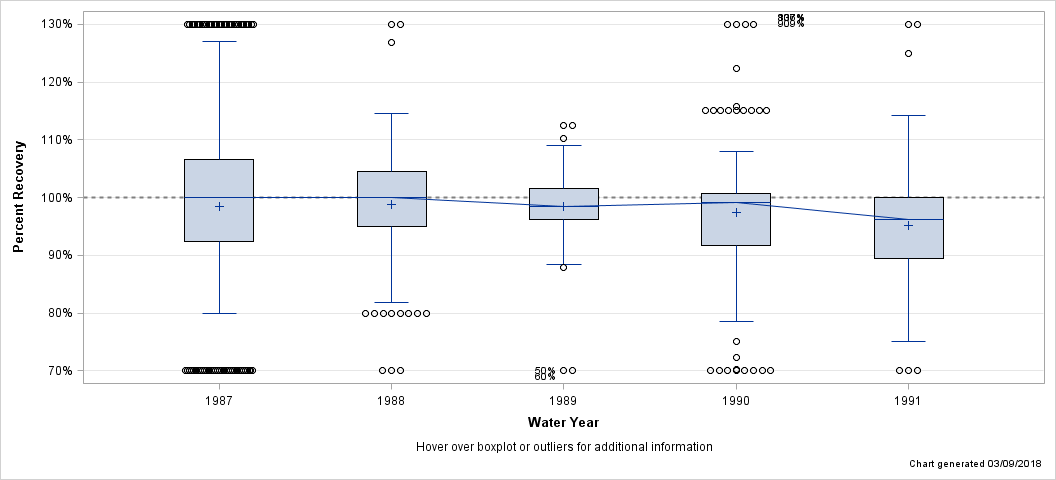
| - Phosphorus (as P), UNF - |
| Lab: NWQL, PCode: 00665, MCode: CL084 |
| Login Dates: 10/14/86 through 09/26/91 |
| Open Data Set |
| Boxplot Description |
| Percent Recovery Statistics for Phosphorus (as P), UNF |
| Analyte | Parm-meth Code | Water Year | # of Samples |
25th Pctl | 50th Pctl (Median) |
75th Pctl |
|---|---|---|---|---|---|---|
| Phosphorus (as P), UNF | 00665CL084 | 1987 | 294 | 92.3% | 100.0% | 106.7% |
| 1988 | 121 | 95.0% | 100.0% | 104.5% | ||
| 1989 | 165 | 96.2% | 98.5% | 101.5% | ||
| 1990 | 138 | 91.7% | 99.2% | 100.7% | ||
| 1991 | 236 | 89.5% | 96.2% | 100.0% |
| Hover over boxplot or outliers for additional information |
| Chart generated 03/09/2018 |
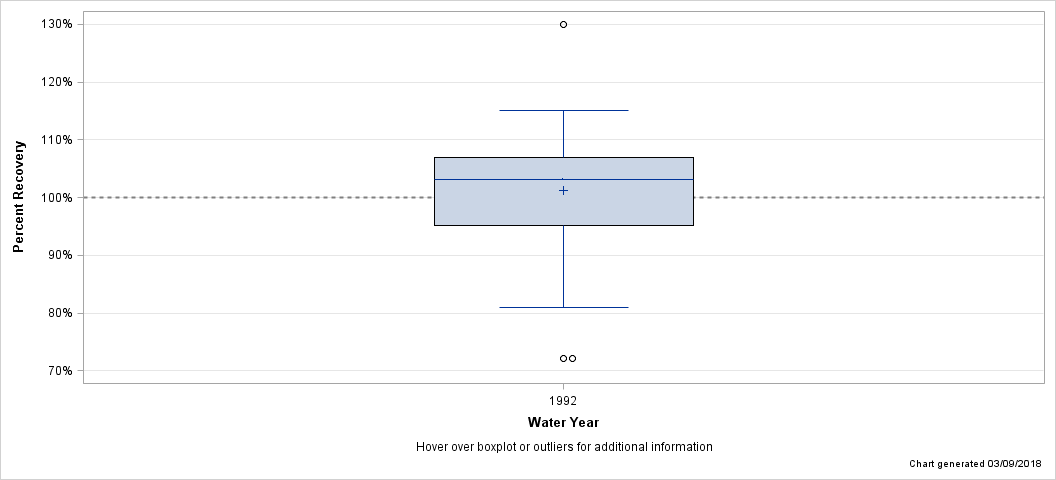
| - Phosphorus (as P), UNF, ASF - |
| Lab: NWQL, PCode: 00665, MCode: KJ010 |
| Login Dates: 10/04/91 through 09/25/92 |
| Open Data Set |
| Boxplot Description |
| Percent Recovery Statistics for Phosphorus (as P), UNF, ASF |
| Analyte | Parm-meth Code | Water Year | # of Samples |
25th Pctl | 50th Pctl (Median) |
75th Pctl |
|---|---|---|---|---|---|---|
| Phosphorus (as P), UNF, ASF | 00665KJ010 | 1992 | 185 | 95.2% | 103.1% | 106.9% |
| Hover over boxplot or outliers for additional information |
| Chart generated 03/09/2018 |
| - Phosphorus (as P), UNF, ASF, Kjeldahl - |
| Lab: NWQL, PCode: 00665, MCode: KJ009 |
| Login Dates: 11/03/94 through 09/24/01 |
| Open Data Set |
| Boxplot Description |
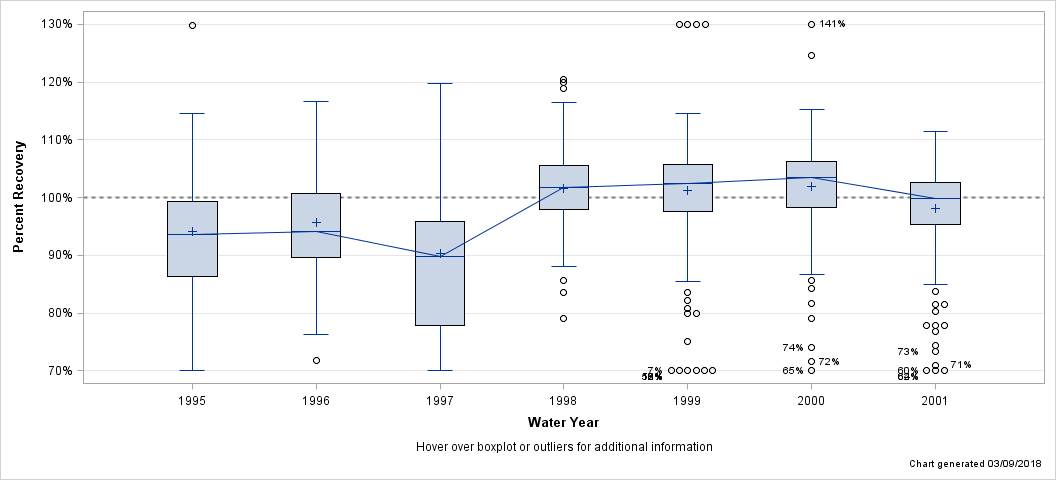
| Percent Recovery Statistics for Phosphorus (as P), UNF, ASF, Kjeldahl |
| Analyte | Parm-meth Code | Water Year | # of Samples |
25th Pctl | 50th Pctl (Median) |
75th Pctl |
|---|---|---|---|---|---|---|
| Phosphorus (as P), UNF, ASF, Kjeldahl | 00665KJ009 | 1995 | 106 | 86.3% | 93.5% | 99.2% |
| 1996 | 110 | 89.7% | 94.2% | 100.7% | ||
| 1997 | 30 | 77.8% | 89.8% | 95.8% | ||
| 1998 | 221 | 98.0% | 101.8% | 105.5% | ||
| 1999 | 214 | 97.5% | 102.4% | 105.7% | ||
| 2000 | 214 | 98.3% | 103.5% | 106.2% | ||
| 2001 | 245 | 95.3% | 99.8% | 102.7% |
| Hover over boxplot or outliers for additional information |
| Chart generated 03/09/2018 |
| - Phosphorus (as P), UNF, CFA, ACD-P, LL - |
| Lab: NWQL, PCode: 00665, MCode: CL021 |
| Login Dates: 07/02/99 through 09/24/01 |
| Open Data Set |
| Boxplot Description |
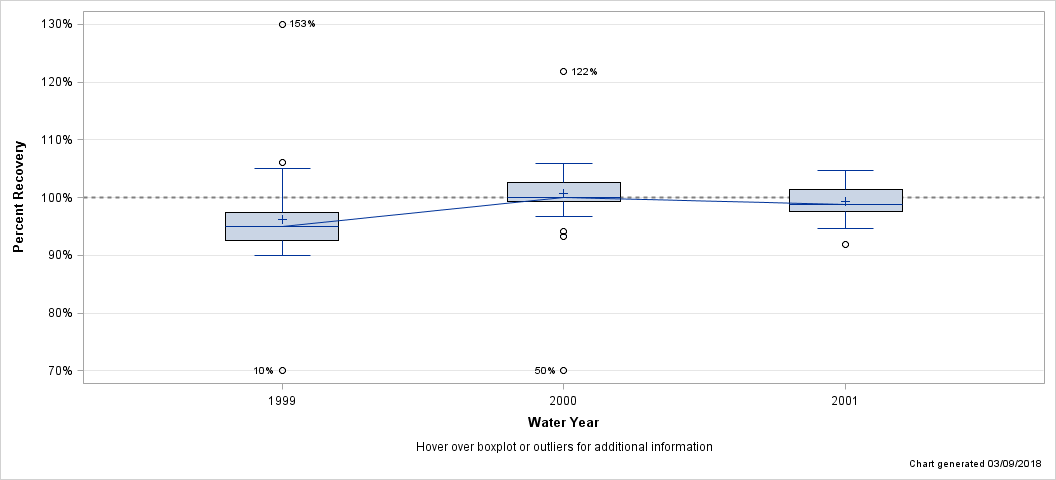
| Percent Recovery Statistics for Phosphorus (as P), UNF, CFA, ACD-P, LL |
| Analyte | Parm-meth Code | Water Year | # of Samples |
25th Pctl | 50th Pctl (Median) |
75th Pctl |
|---|---|---|---|---|---|---|
| Phosphorus (as P), UNF, CFA, ACD-P, LL | 00665CL021 | 1999 | 21 | 92.5% | 95.0% | 97.5% |
| 2000 | 66 | 99.4% | 100.0% | 102.5% | ||
| 2001 | 24 | 97.7% | 98.8% | 101.4% |
| Hover over boxplot or outliers for additional information |
| Chart generated 03/09/2018 |
| - Phosphorus (as P), UNF, COL, LL - |
| Lab: NWQL, PCode: 00665, MCode: CL001 |
| Login Dates: 10/08/91 through 09/18/92 |
| Open Data Set |
| Boxplot Description |
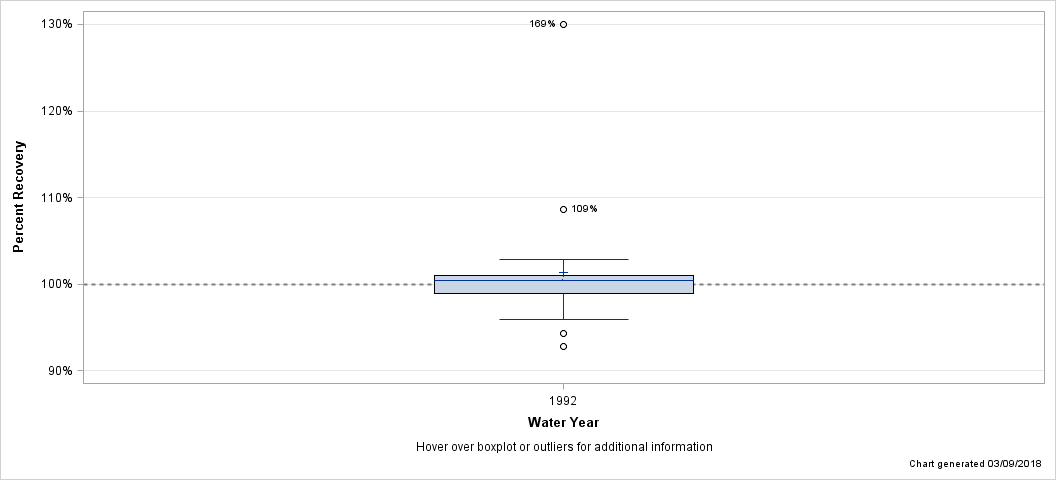
| Percent Recovery Statistics for Phosphorus (as P), UNF, COL, LL |
| Analyte | Parm-meth Code | Water Year | # of Samples |
25th Pctl | 50th Pctl (Median) |
75th Pctl |
|---|---|---|---|---|---|---|
| Phosphorus (as P), UNF, COL, LL | 00665CL001 | 1992 | 21 | 99.0% | 100.5% | 101.0% |
| Hover over boxplot or outliers for additional information |
| Chart generated 03/09/2018 |
| - Phosphorus (as P), UNF, COL, LL - |
| Lab: NWQL, PCode: 00665, MCode: CL090 |
| Login Dates: 11/03/94 through 12/30/98 |
| Open Data Set |
| Boxplot Description |
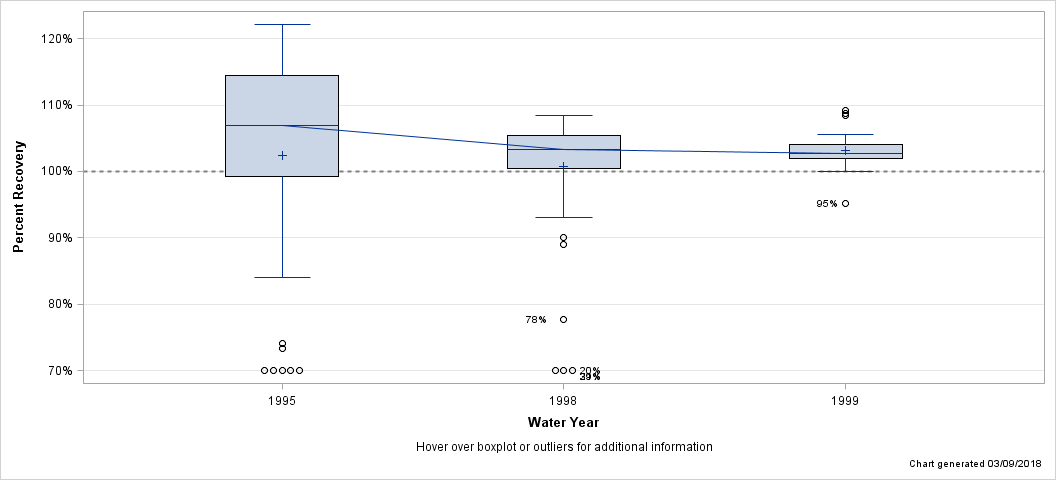
| Percent Recovery Statistics for Phosphorus (as P), UNF, COL, LL |
| Analyte | Parm-meth Code | Water Year | # of Samples |
25th Pctl | 50th Pctl (Median) |
75th Pctl |
|---|---|---|---|---|---|---|
| Phosphorus (as P), UNF, COL, LL | 00665CL090 | 1995 | 57 | 99.2% | 106.9% | 114.5% |
| 1998 | 65 | 100.5% | 103.3% | 105.5% | ||
| 1999 | 21 | 101.9% | 102.7% | 104.1% |
| Hover over boxplot or outliers for additional information |
| Chart generated 03/09/2018 |
| - Phosphorus (as P), UNF, EPA - |
| Lab: NWQL, PCode: 00665, MCode: KJ011 |
| Login Dates: 02/20/96 through 03/26/99 |
| Open Data Set |
| Boxplot Description |
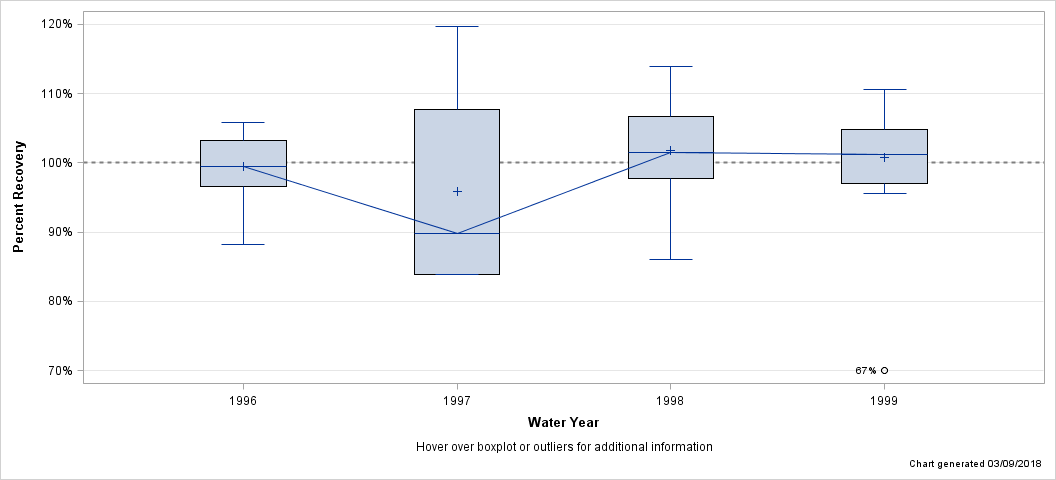
| Percent Recovery Statistics for Phosphorus (as P), UNF, EPA |
| Analyte | Parm-meth Code | Water Year | # of Samples |
25th Pctl | 50th Pctl (Median) |
75th Pctl |
|---|---|---|---|---|---|---|
| Phosphorus (as P), UNF, EPA | 00665KJ011 | 1996 | 16 | 96.6% | 99.5% | 103.3% |
| 1997 | 6 | 83.8% | 89.8% | 107.8% | ||
| 1998 | 32 | 97.8% | 101.5% | 106.8% | ||
| 1999 | 23 | 97.1% | 101.2% | 104.9% |
| Hover over boxplot or outliers for additional information |
| Chart generated 03/09/2018 |